IPLab:Lab 3:Acute Myocardial Infarction: Difference between revisions
| Line 8: | Line 8: | ||
File:IPLab3AcuteMyocardialInfarction1a.JPG|This is a gross photo of the heart at autopsy after the left ventricle was opened. Note the thrombotic material (T) that is present within the left ventricular lumen over the area of infarction. On the cut edge of the left ventricular free wall you can see the areas of hemorrhage and the pale myocardium indicative of an acute myocardial infarction (arrows). | File:IPLab3AcuteMyocardialInfarction1a.JPG|This is a gross photo of the heart at autopsy after the left ventricle was opened. Note the thrombotic material (T) that is present within the left ventricular lumen over the area of infarction. On the cut edge of the left ventricular free wall you can see the areas of hemorrhage and the pale myocardium indicative of an acute myocardial infarction (arrows). | ||
File:IPLab3AcuteMyocardialInfarction1bf.jpg|This is a low-power photomicrograph of infarcted heart. There is a layer of surviving myocardial tissue (1) along the epicardium and then a blue line (2) which represents the accumulation of inflammatory cells at the border of the infarct. There is thrombotic material (T) adherent to the endocardial surface. | File:IPLab3AcuteMyocardialInfarction1bf.jpg|This is a low-power photomicrograph of infarcted heart. There is a layer of surviving myocardial tissue (1) along the epicardium and then a blue line (2) which represents the accumulation of inflammatory cells at the border of the infarct. There is thrombotic material (T) adherent to the endocardial surface. | ||
File: | File:IPLab3AcuteMyocardialInfarction2bs.jpg|This is a higher-power photomicrograph which shows more clearly the viable tissue along the epicardium (Epi), the blue line of inflammatory cells (arrows) with the infarcted myocardium below. | ||
File:IPLab3AcuteMyocardialInfarction3b. | File:IPLab3AcuteMyocardialInfarction3b.jpg|This is a photomicrograph of the edge of the infarct with normal tissue above and infarcted tissue below the line of inflammatory cells (arrow). | ||
File:IPLab3AcuteMyocardialInfarction4b. | File:IPLab3AcuteMyocardialInfarction4b.jpg|This is a higher-power photomicrograph of infarcted tissue just below the line of inflammatory cells. The myocytes have lost their nuclei and the cytoplasm has a granular appearance indicating that this is coagulation necrosis. | ||
File:IPLab3AcuteMyocardialInfarction5b. | File:IPLab3AcuteMyocardialInfarction5b.jpg|This is a high-power photomicrograph of he inflammatory cells present at the border zone between normal and infarcted tissue. Many of the inflammatory cells have begun to die and break down (note blue tinge to tissue) but viable nutrophils and some lymphocutes and macrophages are visible. | ||
File:IPLab3AcuteMyocardialInfarction6.jpg|This is a low-power photomicrograph of a mural thrombus (1) adherent to the endocardial surface (arrows). | File:IPLab3AcuteMyocardialInfarction6.jpg|This is a low-power photomicrograph of a mural thrombus (1) adherent to the endocardial surface (arrows). | ||
File:IPLab3AcuteMyocardialInfarction7.jpg|This is a photomicrograph of the lines of Zahn. Pale areas (1) represent platelets with some fibrin and the darker lines (2) represent RBCs and leukocytes enmeshed in fibrin strands. | File:IPLab3AcuteMyocardialInfarction7.jpg|This is a photomicrograph of the lines of Zahn. Pale areas (1) represent platelets with some fibrin and the darker lines (2) represent RBCs and leukocytes enmeshed in fibrin strands. | ||
Latest revision as of 20:14, 23 June 2020
Clinical Summary
This 78-year-old male experienced a posterior myocardial infarction six years prior to this admission. Recently, he had begun to experience occasional angina. Four days prior to death, he experienced anterior chest pain and discomfort which he regarded as not too distressing. However, EKGs showed a classic acute anterior myocardial infarction in addition to the healed posterior infarct. His bloodwork also showed an elevated troponin. The patient progressively deteriorated with signs of left ventricular failure and died with arrhythmias and pulmonary edema.
At autopsy his heart showed a healed posterior infarct. The right coronary artery was completely occluded but partially recanalized. The left main coronary artery had severe atherosclerotic stenosis and a thrombus filling the lumen. The entire anterolateral aspect of the left ventricle was soft with variegated areas appearing hyperemic or pale. There was extensive mural thrombosis and reactive pericarditis.
Images
-
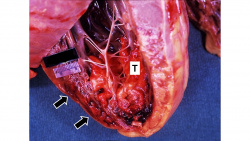 This is a gross photo of the heart at autopsy after the left ventricle was opened. Note the thrombotic material (T) that is present within the left ventricular lumen over the area of infarction. On the cut edge of the left ventricular free wall you can see the areas of hemorrhage and the pale myocardium indicative of an acute myocardial infarction (arrows).
 -
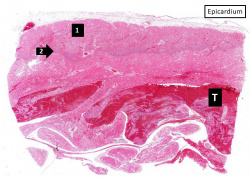 This is a low-power photomicrograph of infarcted heart. There is a layer of surviving myocardial tissue (1) along the epicardium and then a blue line (2) which represents the accumulation of inflammatory cells at the border of the infarct. There is thrombotic material (T) adherent to the endocardial surface.
 -
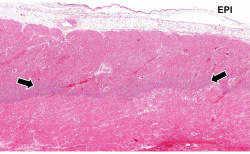 This is a higher-power photomicrograph which shows more clearly the viable tissue along the epicardium (Epi), the blue line of inflammatory cells (arrows) with the infarcted myocardium below.
 -
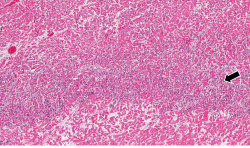 This is a photomicrograph of the edge of the infarct with normal tissue above and infarcted tissue below the line of inflammatory cells (arrow).
 -
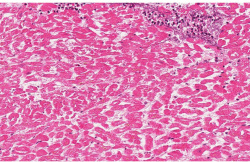 This is a higher-power photomicrograph of infarcted tissue just below the line of inflammatory cells. The myocytes have lost their nuclei and the cytoplasm has a granular appearance indicating that this is coagulation necrosis.
 -
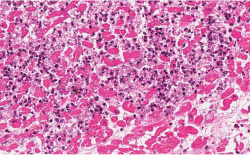 This is a high-power photomicrograph of he inflammatory cells present at the border zone between normal and infarcted tissue. Many of the inflammatory cells have begun to die and break down (note blue tinge to tissue) but viable nutrophils and some lymphocutes and macrophages are visible.
 -
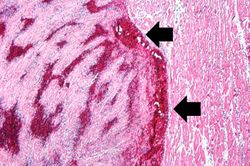 This is a low-power photomicrograph of a mural thrombus (1) adherent to the endocardial surface (arrows).
 -
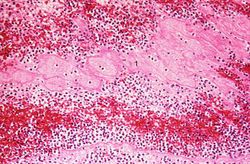 This is a photomicrograph of the lines of Zahn. Pale areas (1) represent platelets with some fibrin and the darker lines (2) represent RBCs and leukocytes enmeshed in fibrin strands.


Virtual Microscopy
Heart: Acute Myocardial Infarction
Normal Heart
Study Questions
Additional Resources
Reference
Journal Articles
- Helft G, Worthley SG. Anti-thrombotic, anti-platelet and fibrinolytic therapy: current management of acute myocardial infarction. Heart Lung Circ 2001;10(2):68-74.
Images
Related IPLab Cases
- Lab 1: Heart: Myocardial Infarction (Coagulative Necrosis)
- Lab 3: Heart: Healed Myocardial Infarction
- Lab 4: Heart: Mural Thrombus
- Lab 4: Coronary Artery: Thrombosis
- Lab 4: Lung: Pulmonary Congestion and Edema