File list
This special page shows all uploaded files.
| Date | Name | Thumbnail | Size | Description | Versions |
|---|---|---|---|---|---|
| 21:51, 9 July 2020 | IPLab10Histo1b.jpg (file) |  |
386 KB | 1 | |
| 21:58, 27 June 2019 | IPLab1FatNecrosis10.jpg (file) |  |
166 KB | 1 | |
| 21:40, 27 June 2019 | IPLab1FatNecrosis8.jpg (file) |  |
166 KB | 2 | |
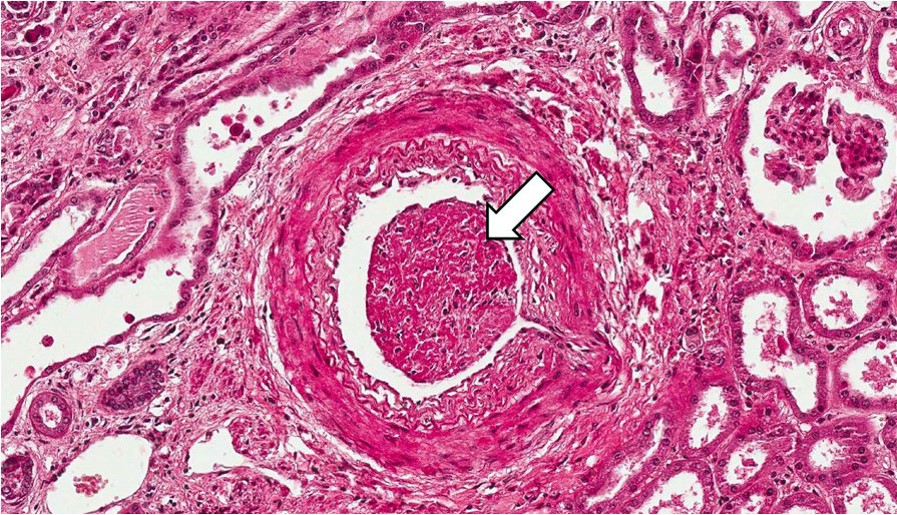
| 21:15, 27 June 2019 | IPLab1KidneyInfarction4.jpg (file) |  |
228 KB | 2 | |
| 21:20, 27 June 2019 | IPLab1KidneyInfarction5.jpg (file) |  |
242 KB | 2 | |
| 21:22, 27 June 2019 | IPLab1KidneyInfarction6.jpg (file) |  |
258 KB | 2 | |
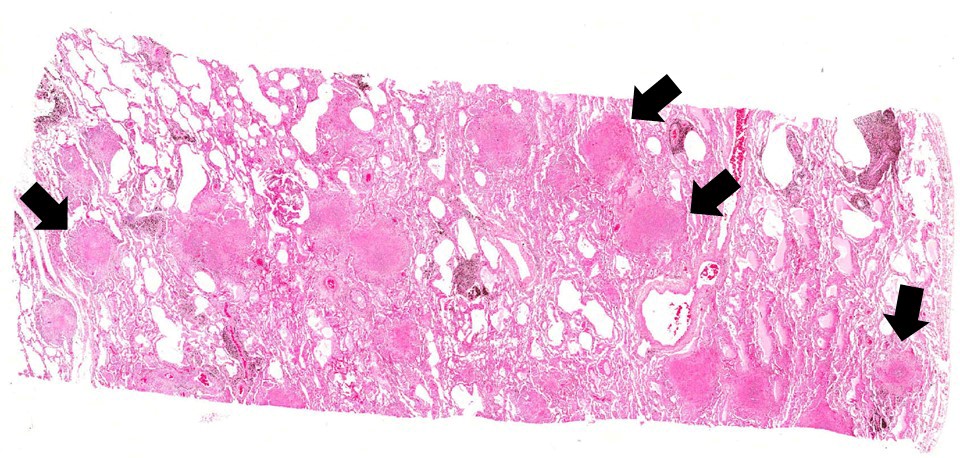
| 22:04, 27 June 2019 | IPLab1Tuberculosis4b.jpg (file) |  |
172 KB | 1 | |
| 22:05, 27 June 2019 | IPLab1Tuberculosis5b.jpg (file) |  |
260 KB | 1 | |
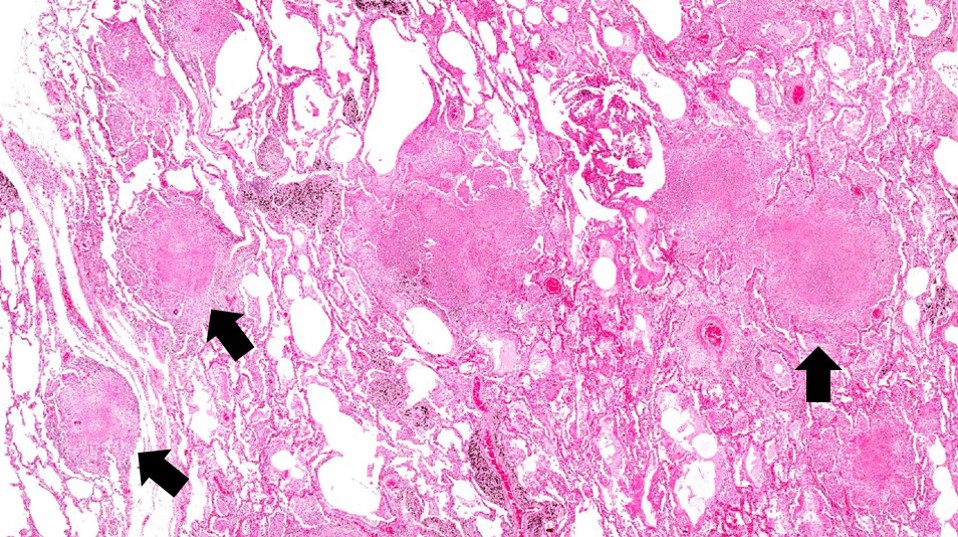
| 22:06, 27 June 2019 | IPLab1Tuberculosis6b.jpg (file) |  |
200 KB | 1 | |
| 22:06, 27 June 2019 | IPLab1Tuberculosis7b.jpg (file) |  |
258 KB | 1 | |
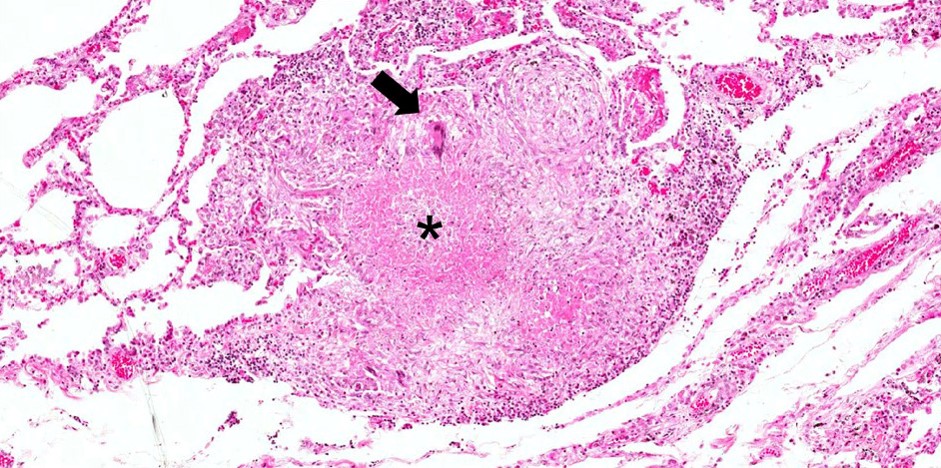
| 18:42, 31 October 2016 | IPLab1Tuberculosis8.jpg (file) |  |
246 KB | 1 | |
| 18:55, 31 October 2016 | IPLab1Tuberculosis8b.jpg (file) |  |
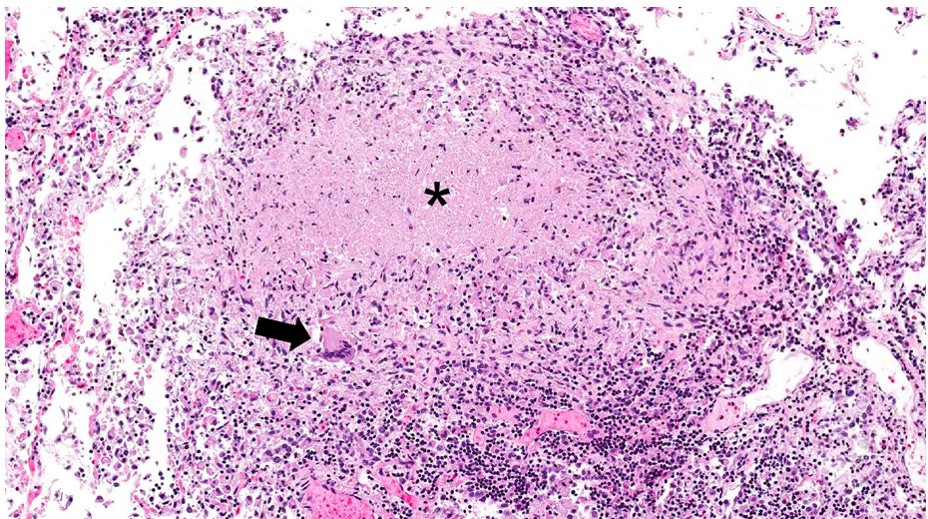
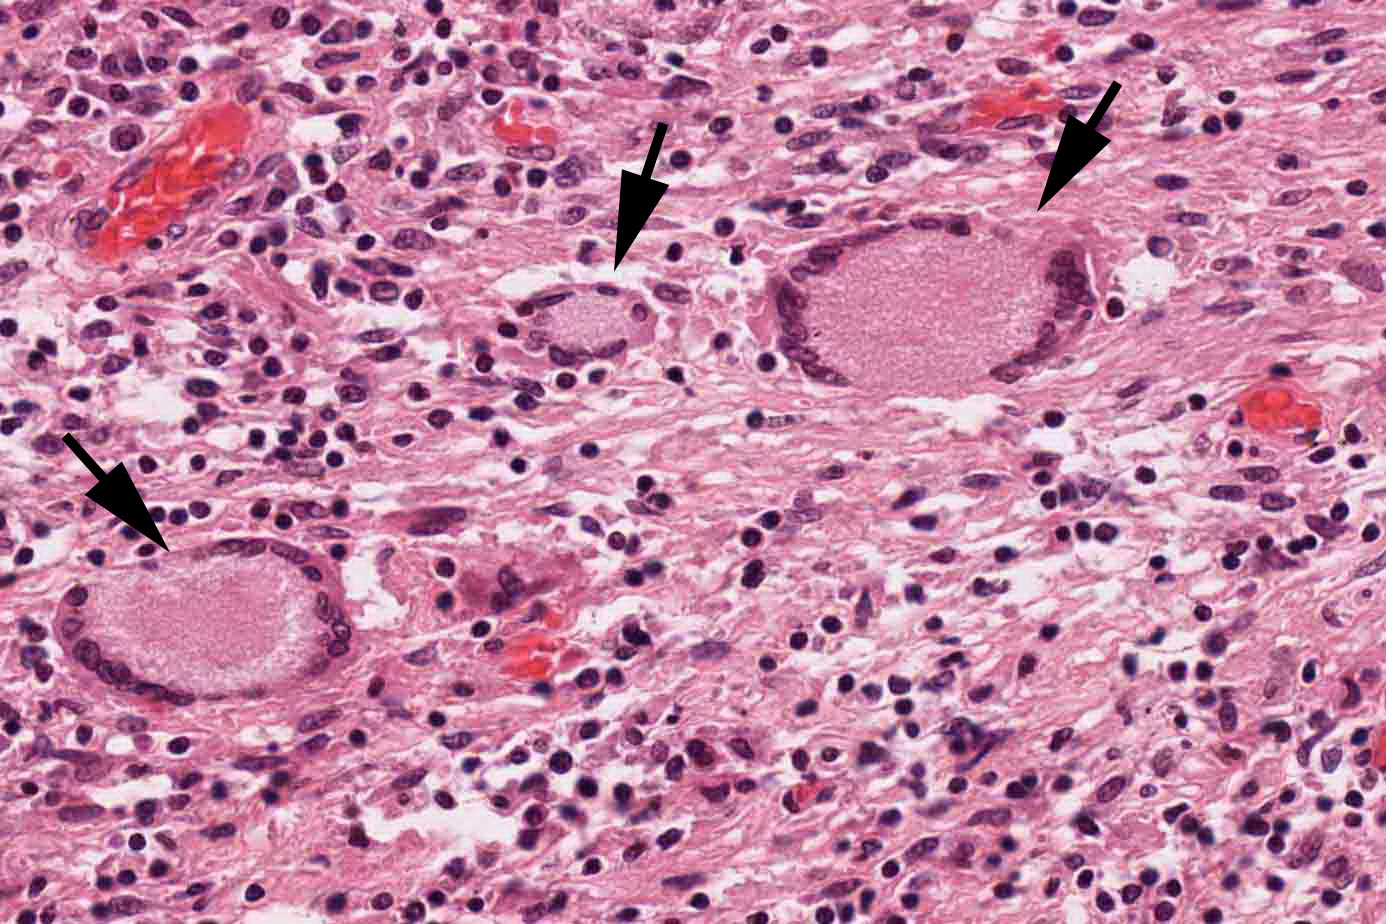
246 KB | This is a high-power photomicrograph of Langhans-type multinucleated giant cells (arrows) that are characteristic of tuberculous granulomas. Note the ring of the nuclei in these giant cells. | 1 |
| 16:00, 19 August 2013 | IPLab2Atrophy1.jpg (file) |  |
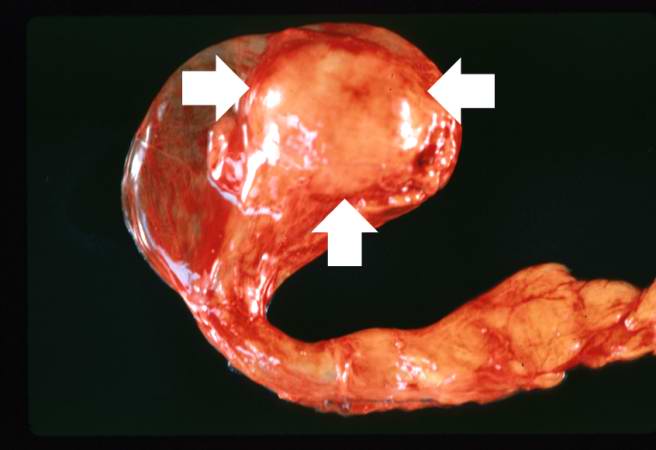
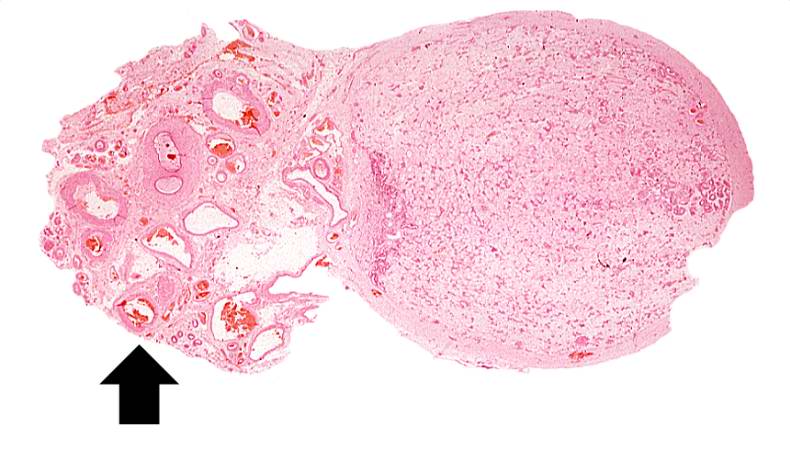
23 KB | This is a gross photograph of an atrophied testis (arrows). | 1 |
| 16:12, 19 August 2013 | IPLab2Atrophy10.jpg (file) |  |
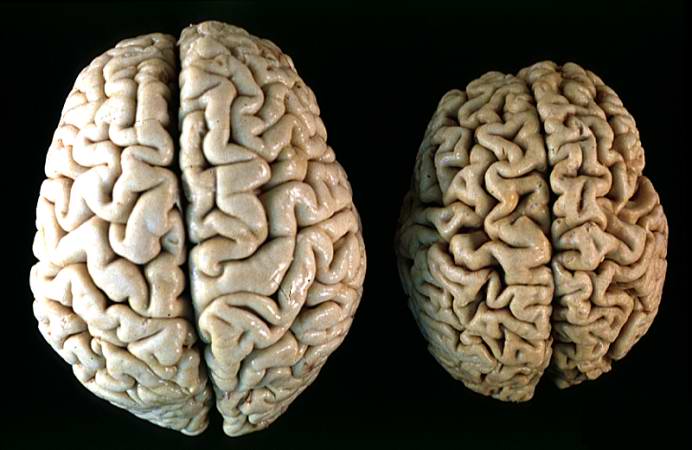
43 KB | This gross photograph shows a normal brain (left) and a brain from a geriatric patient (right). Note the decreased size, the narrowed gyri, and the widened sulci of the brain from this octogenarian. What is the cause of atrophy in this case? | 1 |
| 16:01, 19 August 2013 | IPLab2Atrophy2.jpg (file) |  |
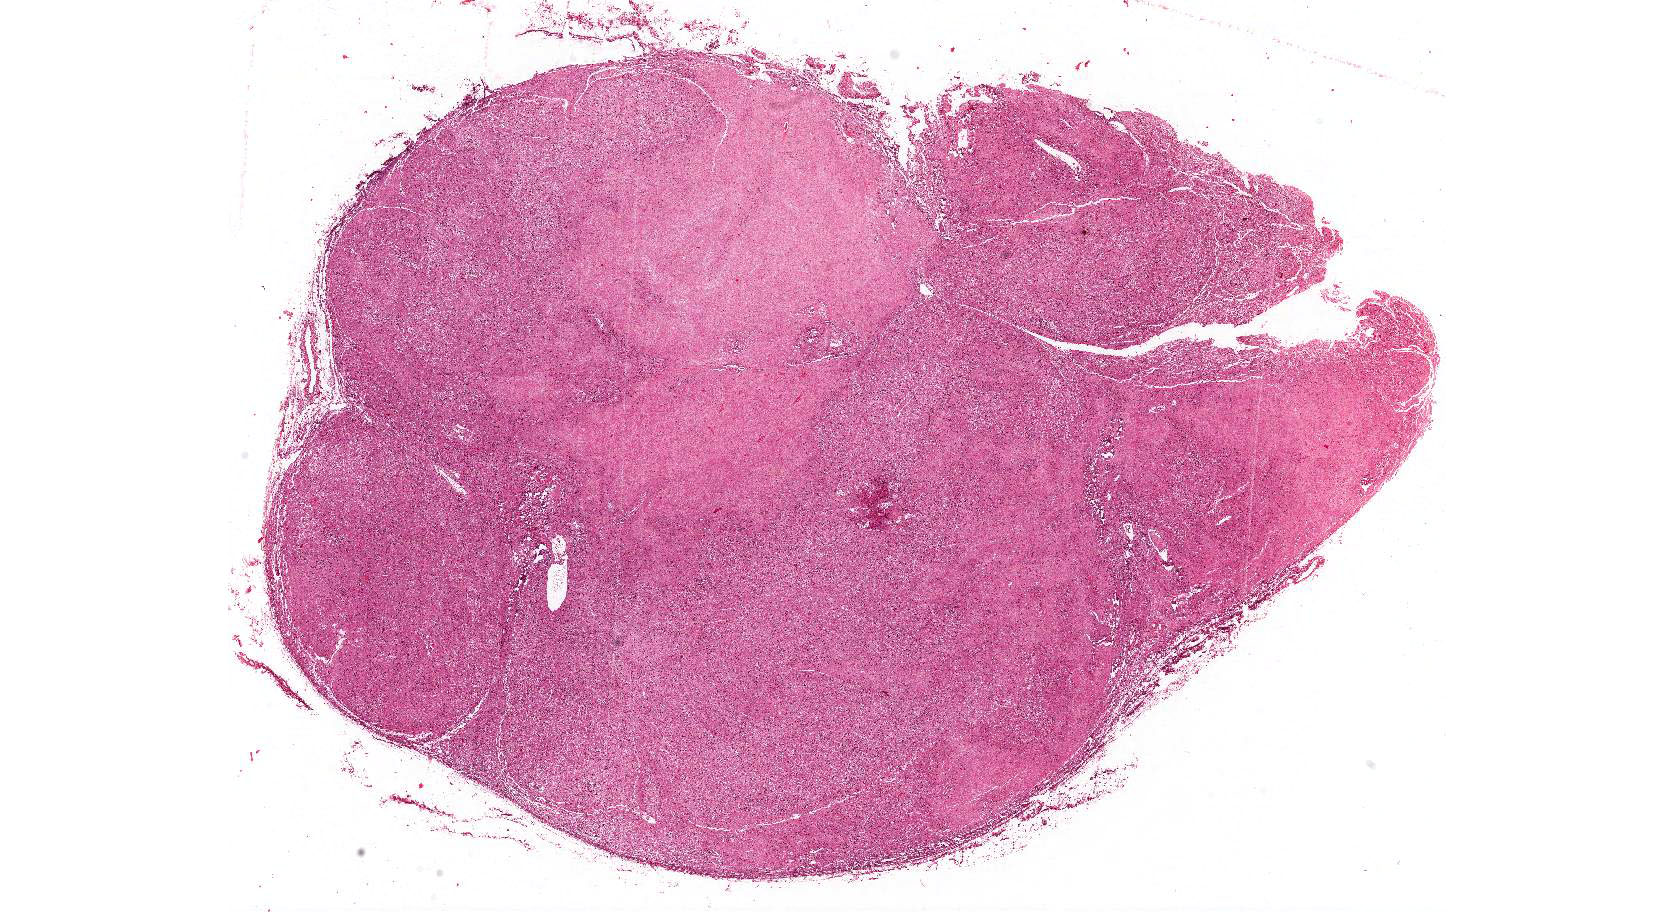
53 KB | This is a low-power photomicrograph of an atrophic testis. Attached to the testis are several vessels (arrow) which are part of the epididymis and the vas deferens. | 1 |
| 16:01, 19 August 2013 | IPLab2Atrophy3.jpg (file) |  |
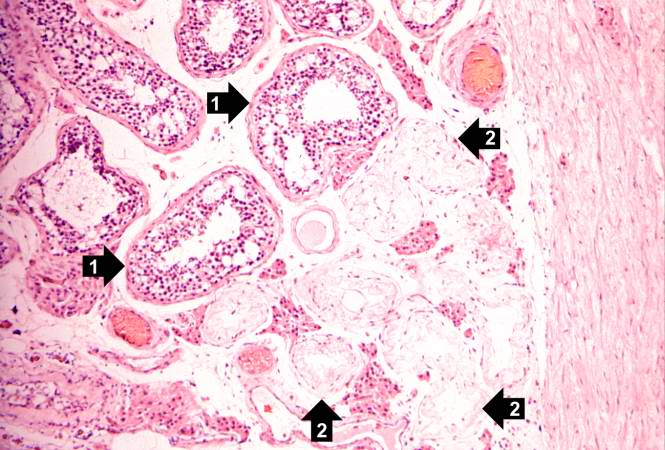
65 KB | This is a higher-power photomicrograph of an atrophic testis. In this section there are seminiferous tubules with viable cells (1) although there are no visible spermatocytes. Other seminiferous tubules are completely acellular and have a pale pink hya... | 1 |
| 16:03, 19 August 2013 | IPLab2Atrophy4.jpg (file) |  |
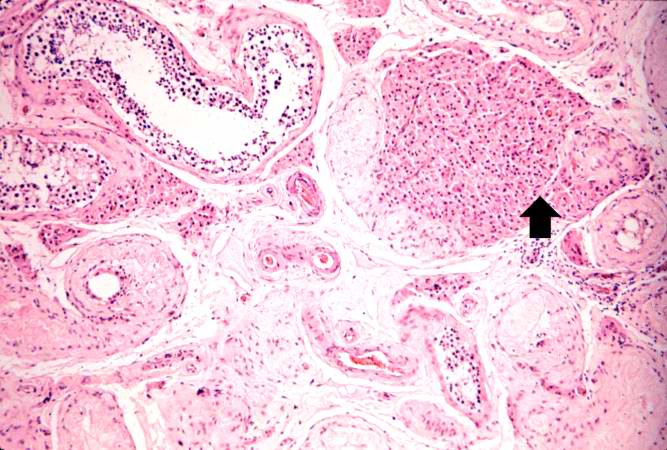
68 KB | This is a higher-power photomicrograph indicating loss of testicular parenchymal tissue. There are very few recognizable spermatic cells in this tissue. The cluster of cells in the upper right is a focus of interstitial or Leydig cells (arrow). These c... | 1 |
| 16:04, 19 August 2013 | IPLab2Atrophy5.jpg (file) |  |
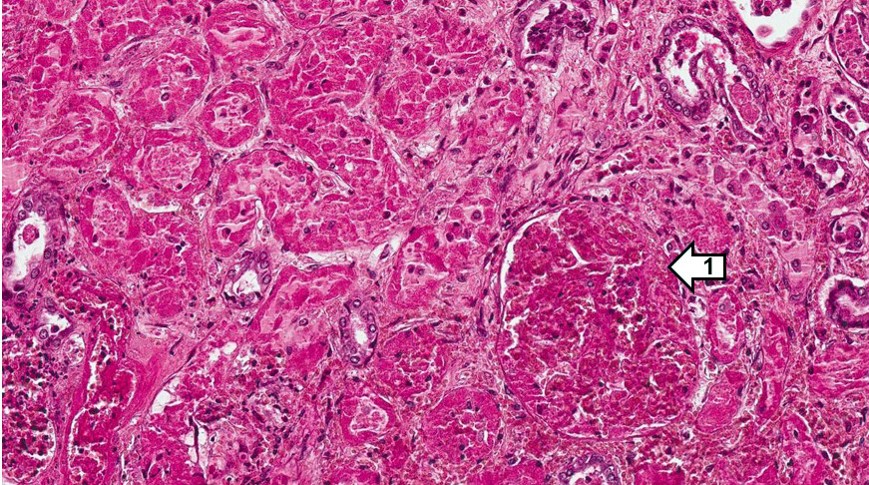
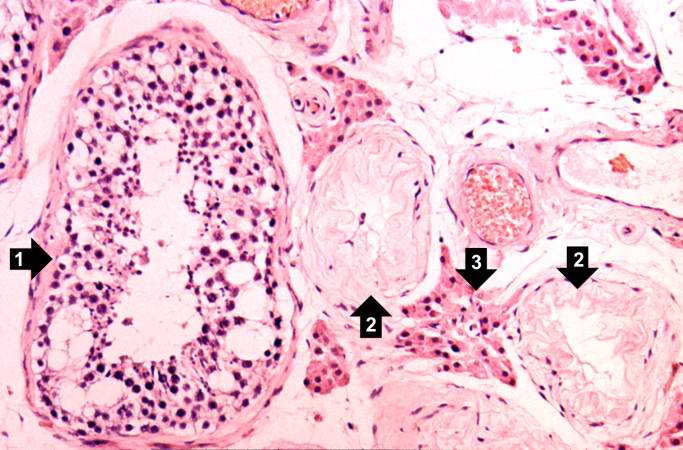
60 KB | A seminiferous tubule is shown on the left containing remnants of spermatocytes (1). There are no mature sperm present. On the right-hand portion of the slide are remnants of other spermatic tubules which have completely atrophied and lost all of their... | 1 |
| 16:07, 19 August 2013 | IPLab2Atrophy6.jpg (file) |  |
52 KB | In this slide, the atrophy of the tubules is extending to include the Rete testes (arrow) as well. | 1 |
| 16:10, 19 August 2013 | IPLab2Atrophy7.jpg (file) |  |
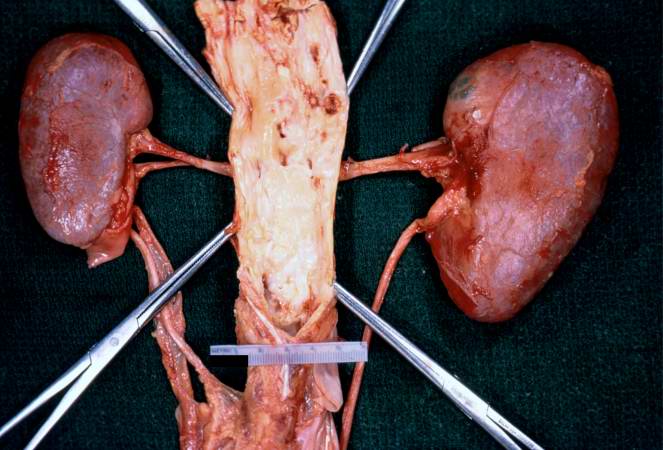
50 KB | In this gross photograph of kidneys and the abdominal aorta, there is narrowing of the left renal artery at its ostium from the aorta. This atherosclerotic narrowing of the renal artery causes reduced blood pressure in the kidney whose artery is affect... | 1 |
| 16:11, 19 August 2013 | IPLab2Atrophy8.jpg (file) |  |
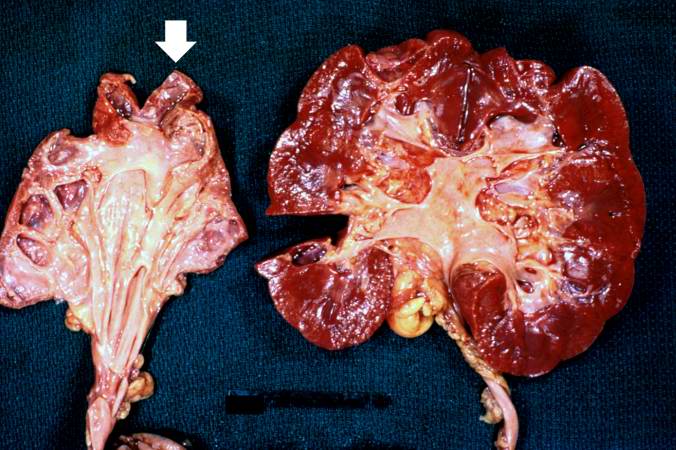
64 KB | These kidneys were removed from a patient who had blockage of one ureter leading to increased pressure in the renal pelvis. The increased pressure produced hydronephrosis (arrow) in one kidney. What is the cause of atrophy in this case? | 1 |
| 16:11, 19 August 2013 | IPLab2Atrophy9.jpg (file) |  |
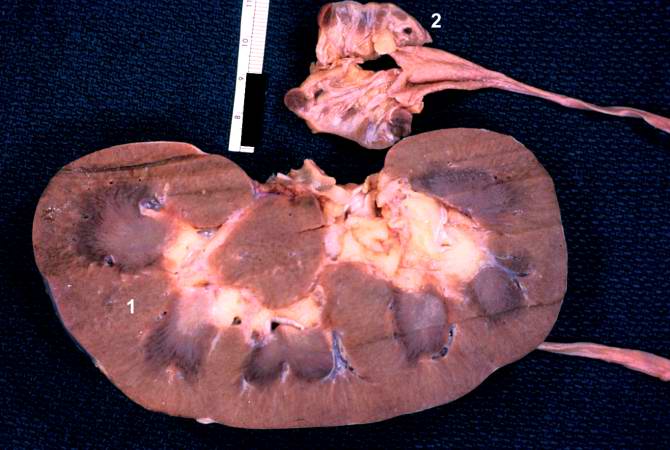
47 KB | The two kidneys in this slide are from the same patient. One kidney (1) is relatively normal, although increased in size due to compensatory hypertrophy. The other kidney (2) is very small with only rudimentary nodules of renal parenchyma. This kidney ... | 1 |
| 16:32, 19 August 2013 | IPLab2Calcification1.jpg (file) |  |
72 KB | This is a gross photograph of the cut section of the patient's lung showing evidence of severe metastatic calcification. The lung tissue has a rough, firm appearance with open airways. | 1 |
| 16:38, 19 August 2013 | IPLab2Calcification2.jpg (file) |  |
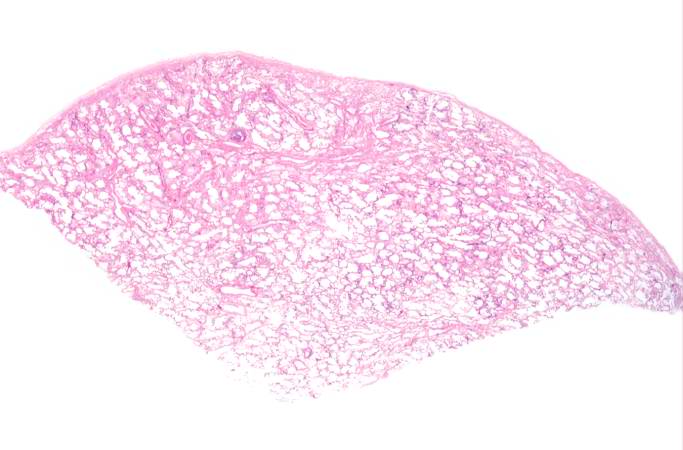
37 KB | This low-power photomicrograph of the patient's lung illustrates large, open alveolar spaces. The pleural surface is the curved surface at the top. | 1 |
| 16:33, 19 August 2013 | IPLab2Calcification3.jpg (file) |  |
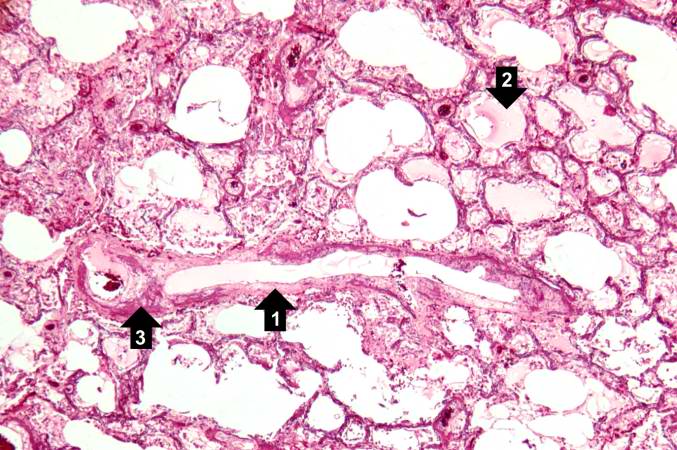
78 KB | A higher-power photomicrograph shows a blood vessel cut in longitudinal section (1). Several of the alveoli are filled with a pink-staining proteinaceous fluid (2) indicative of pulmonary edema. The alveolar septa and the wall of the blood vessel have ... | 1 |
| 16:34, 19 August 2013 | IPLab2Calcification4.jpg (file) |  |
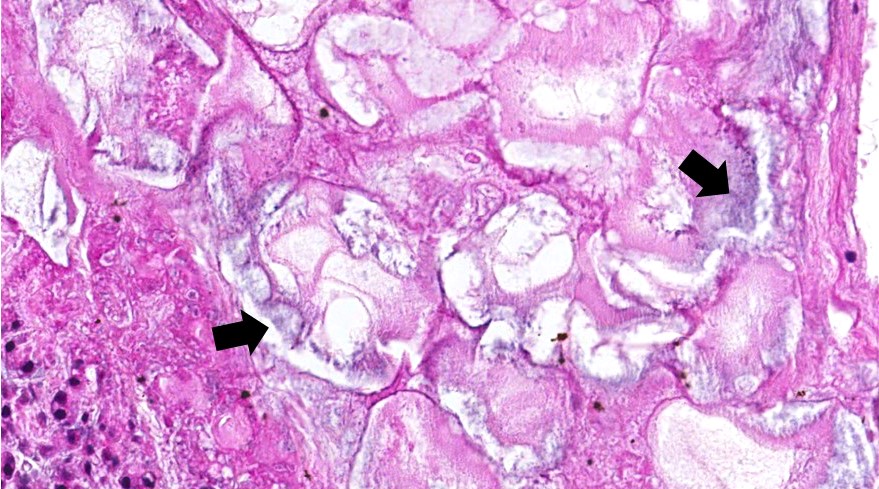
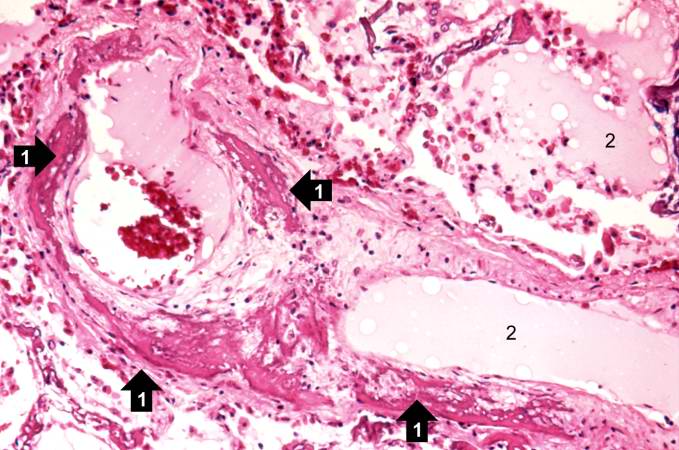
65 KB | This high-power photomicrograph of a blood vessel shows calcium deposits in the vascular wall (1) and proteinaceous material (2) (from edema) within some of the alveoli. The smooth muscle in the vessel wall has been almost completely replaced by calciu... | 1 |
| 16:34, 19 August 2013 | IPLab2Calcification5.jpg (file) |  |
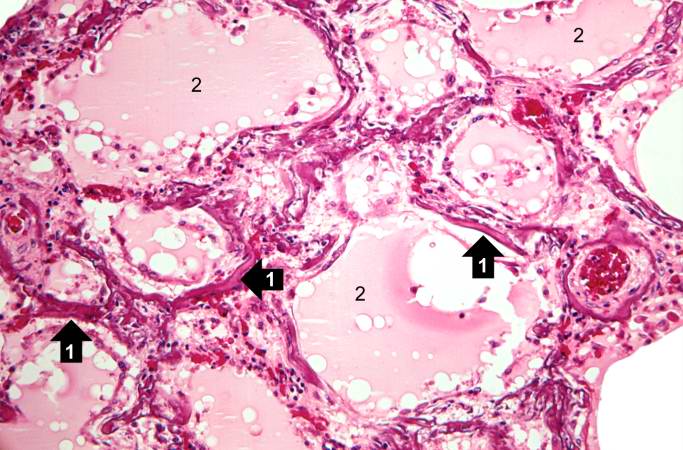
68 KB | This photomicrograph demonstrates pulmonary alveoli with extensive calcium depositions (1) in the septa and protein accumulations (2) in the alveoli. | 1 |
| 16:35, 19 August 2013 | IPLab2Calcification6.jpg (file) |  |
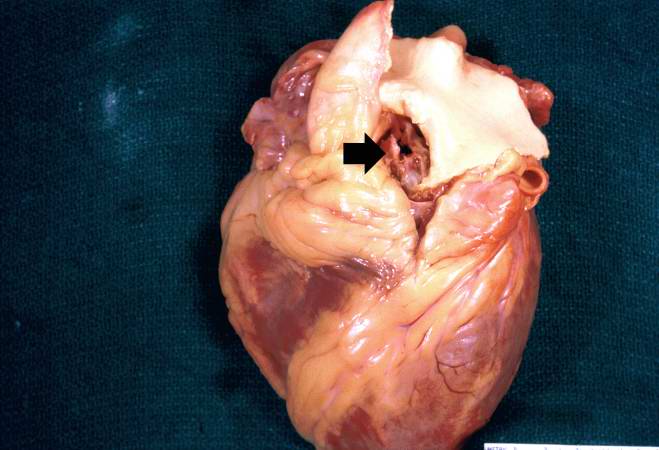
39 KB | Metastatic calcification is only one of two forms of pathologic calcification. Unlike metastatic calcification, dystrophic calcification does not require an increase in serum calcium levels. This is a gross specimen of a heart with dystrophic calcifica... | 1 |
| 16:36, 19 August 2013 | IPLab2Calcification7.jpg (file) |  |
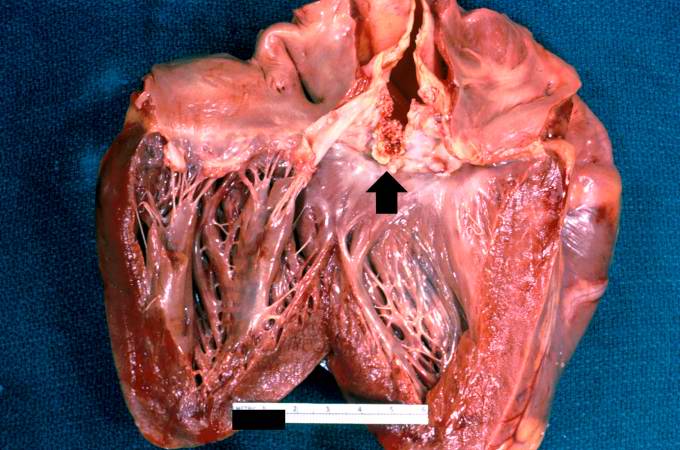
59 KB | A closer view of this same aortic valve (arrow) illustrates the nodularity and thickening of this valve. This valve would be extremely stiff and almost entirely immobile. This particular example of dystrophic calcification is associated with a degenera... | 1 |
| 16:36, 19 August 2013 | IPLab2Calcification8.jpg (file) |  |
45 KB | This gross photograph affords a closer view of the same aortic valve. Note the nodularity and thickening of this valve due to fibrosis and dystrophic calcification. | 1 |
| 16:53, 19 August 2013 | IPLab2FattyChange1.jpg (file) |  |
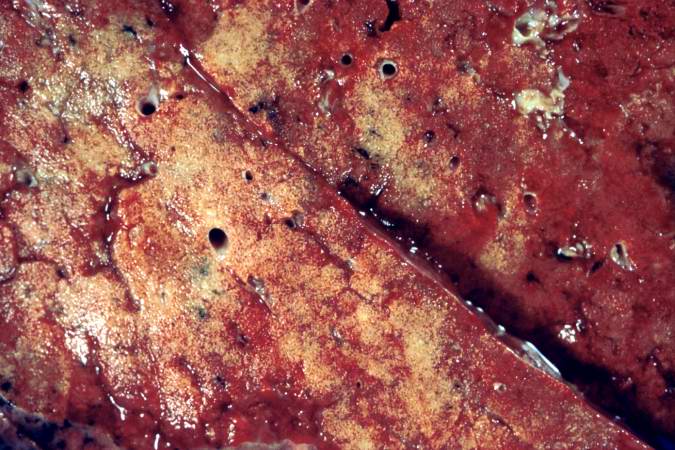
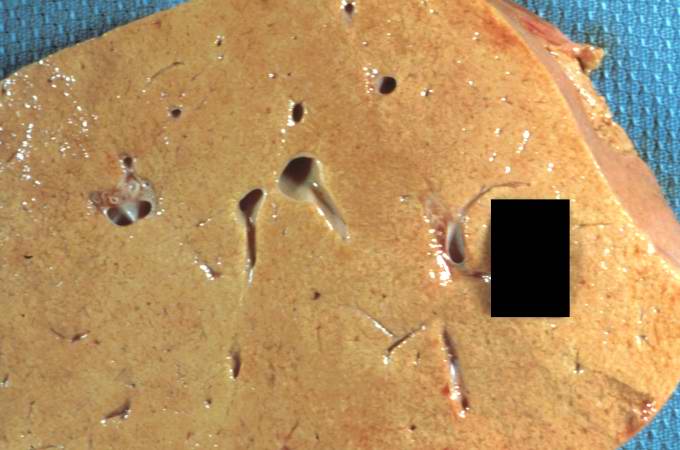
42 KB | This gross photograph of liver tissue illustrates the yellowish color of the liver parenchyma. The yellow color indicates high fat content in this tissue. Compare this with the normal dark red color of liver. | 1 |
| 20:44, 19 June 2020 | IPLab2FattyChange10.jpg (file) |  |
672 KB | 2 | |
| 20:51, 19 June 2020 | IPLab2FattyChange10b.jpg (file) |  |
672 KB | 1 | |
| 17:00, 19 August 2013 | IPLab2FattyChange11.jpg (file) |  |
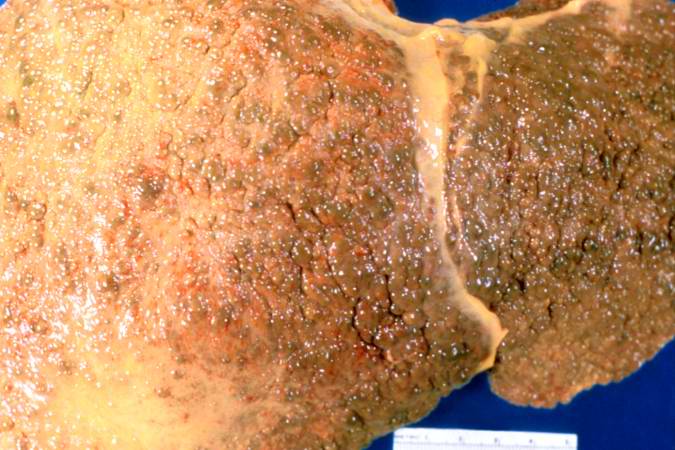
58 KB | This gross photograph of liver demonstrates severe nodular cirrhosis. Note the extensive scarring of the capsule and the nodular projections of tissue through the uncut capsule in this tissue. The green color is due to the accumulation of bile pigment. | 1 |
| 17:02, 19 August 2013 | IPLab2FattyChange12.jpg (file) |  |
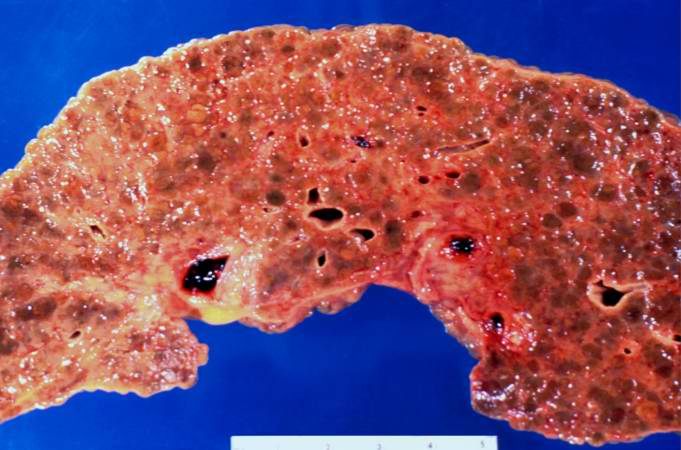
49 KB | This is a cut surface of the same tissue seen in the previous slide. Note the marked nodular pattern. The paler-staining areas between the round nodules represent fibrous connective tissue. | 1 |
| 16:54, 19 August 2013 | IPLab2FattyChange2.jpg (file) |  |
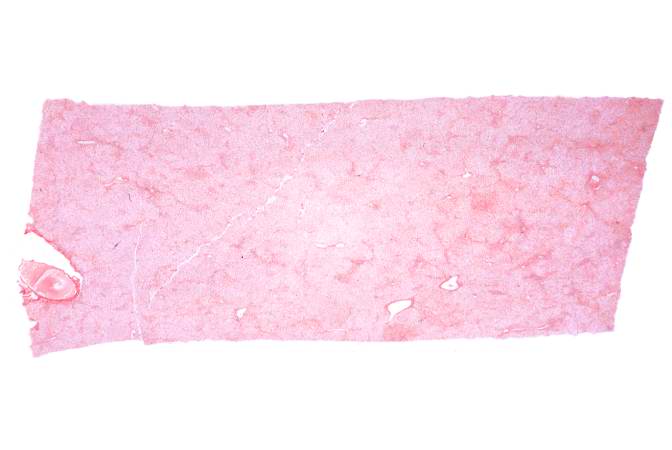
22 KB | This low-power photomicrograph of liver illustrates a very pale-staining section with a uniform appearance throughout the section. | 1 |
| 16:55, 19 August 2013 | IPLab2FattyChange3.jpg (file) |  |
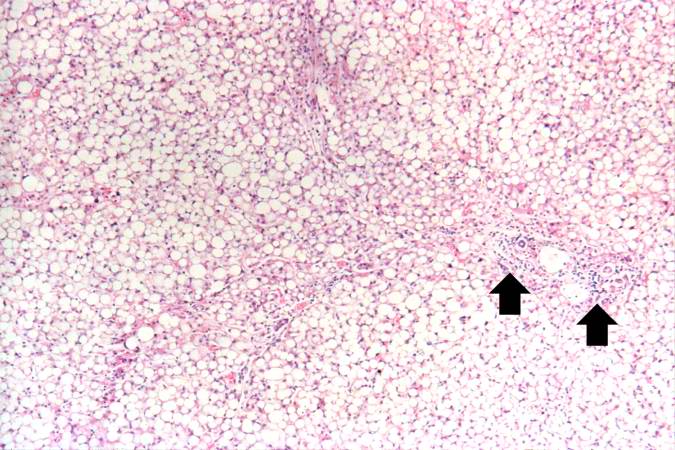
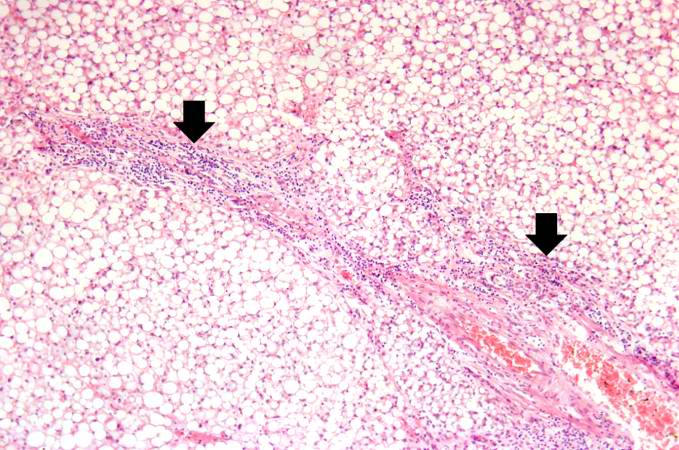
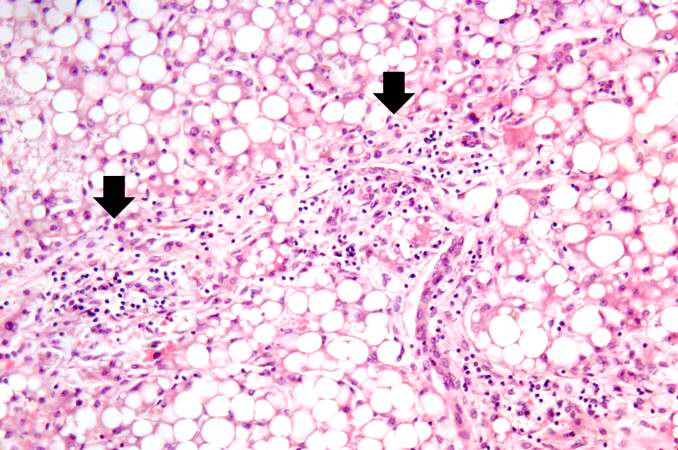
73 KB | Another low-power photomicrograph illustrates again the pale, washed-out appearance of this tissue. Notice the numerous holes throughout the tissue. There are accumulations of inflammatory cells (arrows) around portal tracts. | 1 |
| 20:54, 19 June 2020 | IPLab2FattyChange3b.jpg (file) |  |
684 KB | 1 | |
| 16:56, 19 August 2013 | IPLab2FattyChange4.jpg (file) |  |
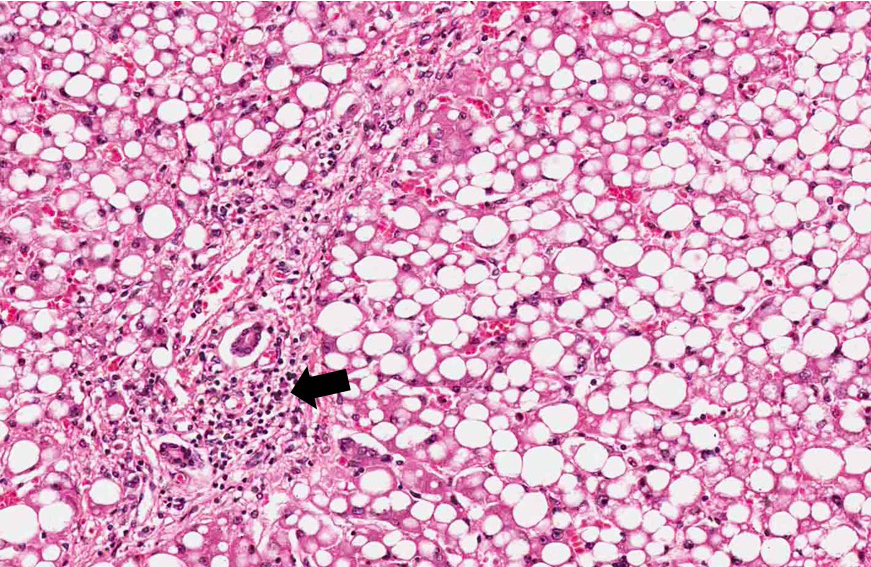
77 KB | A higher-power photomicrograph illustrates more clearly the inflammatory cells (arrows) around the portal areas. | 1 |
| 20:55, 19 June 2020 | IPLab2FattyChange4b.jpg (file) |  |
667 KB | 1 | |
| 16:56, 19 August 2013 | IPLab2FattyChange5.jpg (file) |  |
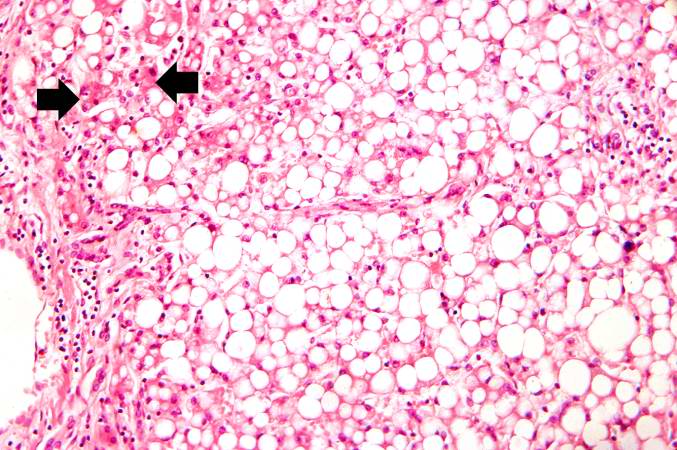
75 KB | This higher-power photomicrograph of the centrilobular area gives the appearance of fatty tissue, as indicated by many empty spaces. Very few normal liver cells can be seen in this slide. A few more normal-appearing hepatocytes are present at the left ... | 1 |
| 20:56, 19 June 2020 | IPLab2FattyChange5b.jpg (file) |  |
436 KB | 1 | |
| 16:57, 19 August 2013 | IPLab2FattyChange6.jpg (file) |  |
67 KB | Another view at the same power illustrates the proliferation of bile ducts in the interlobular and perichordal regions (arrows). | 1 |
| 16:58, 19 August 2013 | IPLab2FattyChange7.jpg (file) |  |
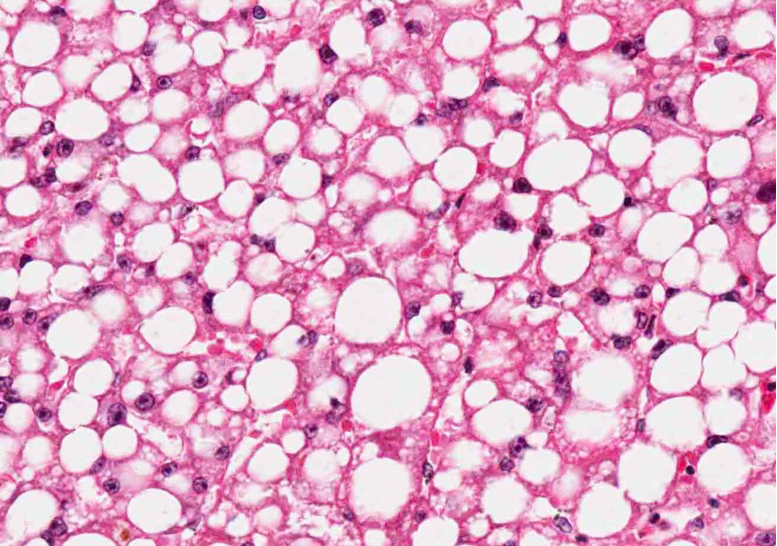
65 KB | A high-power photomicrograph of the liver parenchyma shows that each individual liver cell is filled with a large, clear droplet which represents the space remaining after lipid was dissolved by the dehydration procedure used to embed the tissue. '''No... | 1 |
| 16:58, 19 August 2013 | IPLab2FattyChange8.jpg (file) |  |
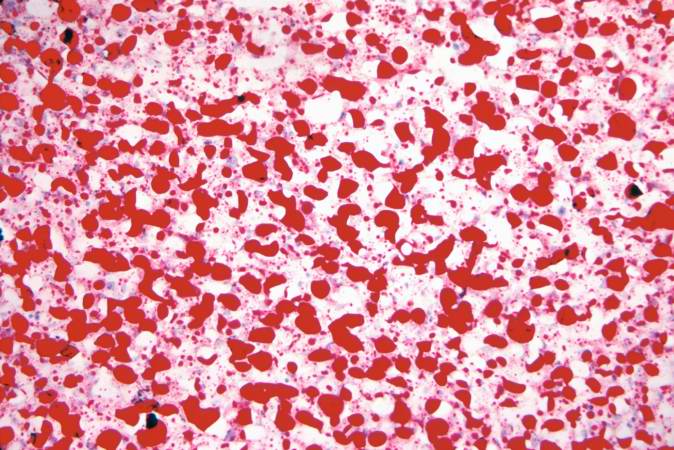
78 KB | An oil red O stain for fat was performed on a frozen section of this liver tissue. The red droplets represent fat in the tissue which is typical of fatty degeneration in the liver. By using frozen sections the tissues do not have to be dehydrated throu... | 1 |
| 16:59, 19 August 2013 | IPLab2FattyChange9.jpg (file) |  |
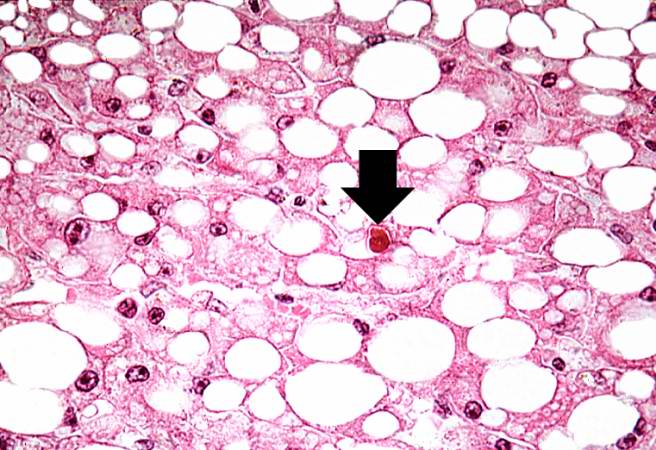
58 KB | This photomicrograph of the liver is from another patient with a history of alcohol use. There are some clear vacuoles indicating fat droplets (1) and there are numerous red-staining granular deposits within the cytoplasm of hepatocytes (2)--this is al... | 1 |
| 15:27, 19 August 2013 | IPLab2Hyperplasia1.jpg (file) |  |
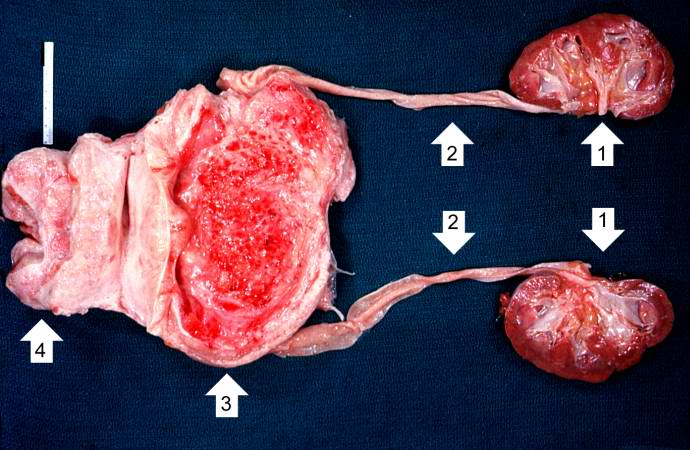
58 KB | This photograph shows the autopsy specimen from this patient. Included are kidneys (1), ureters (2), bladder (3) (which has been opened), and enlarged prostate (4). Note that the bladder mucosa has multiple trabeculae and the bladder mucosa is hyperemi... | 1 |
| 15:27, 19 August 2013 | IPLab2Hyperplasia2.jpg (file) |  |
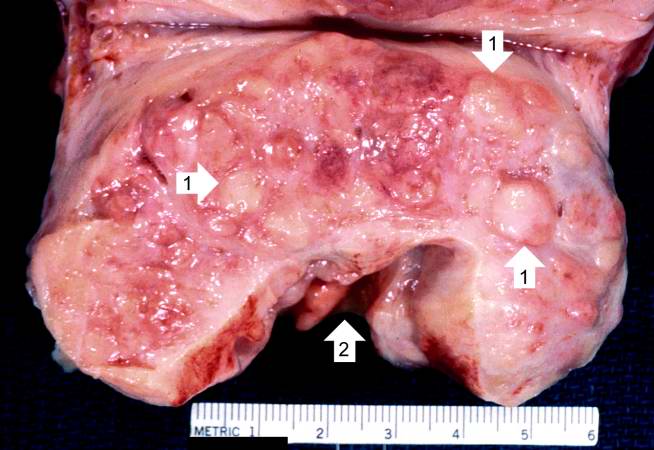
44 KB | This is a close-up of the prostate from this same patient. Note the nodularity of the tissue (1) and the enlargement of the gland. Enlargement of the prostate leads to compression of the urethra as it passes through (2) the gland. | 1 |
| 15:28, 19 August 2013 | IPLab2Hyperplasia3.jpg (file) |  |
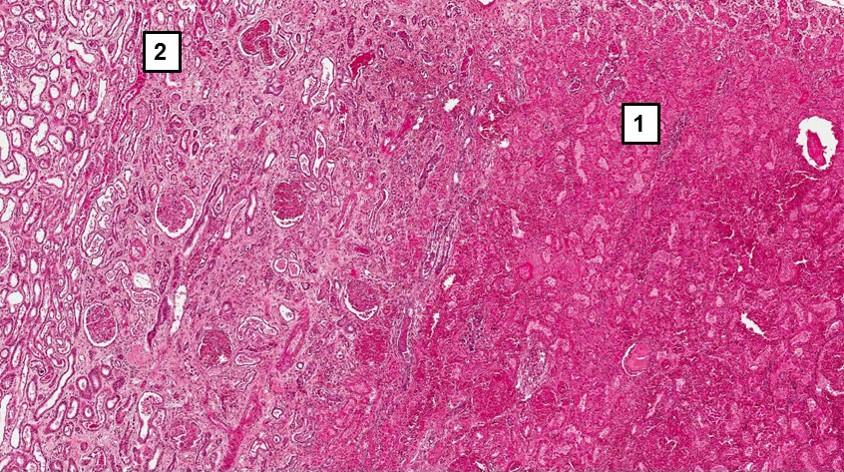
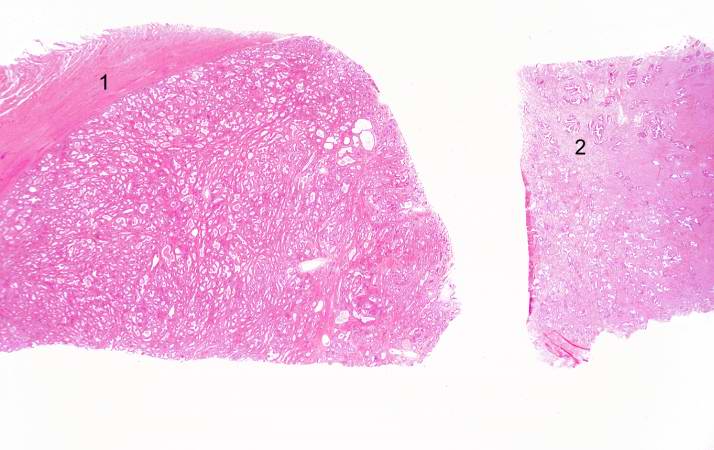
48 KB | This is a low-power photomicrograph showing hyperplastic prostate on the left (1) and normal prostate on the right (2). At this power, dilated glands are visible in the section of hyperplastic prostate. | 1 |
| 15:28, 19 August 2013 | IPLab2Hyperplasia4.jpg (file) |  |
69 KB | The dilated glands (arrows) make up the major portion of the prostate tissue and there is compression of the stroma. | 1 |