File list
This special page shows all uploaded files.
| Date | Name | Thumbnail | Size | Description | Versions |
|---|---|---|---|---|---|
| 16:35, 19 August 2013 | IPLab4Thrombosis1.jpg (file) |  |
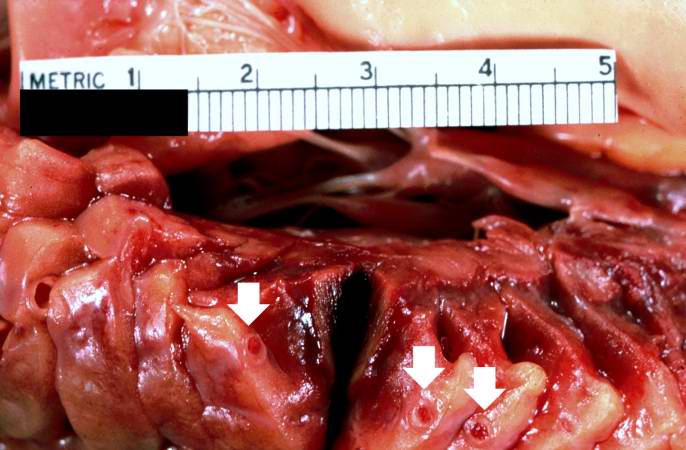
47 KB | This is a gross photograph of thrombosed coronary artery (arrows). | 1 |
| 16:30, 19 August 2013 | IPLab4MuralThrombus7.jpg (file) |  |
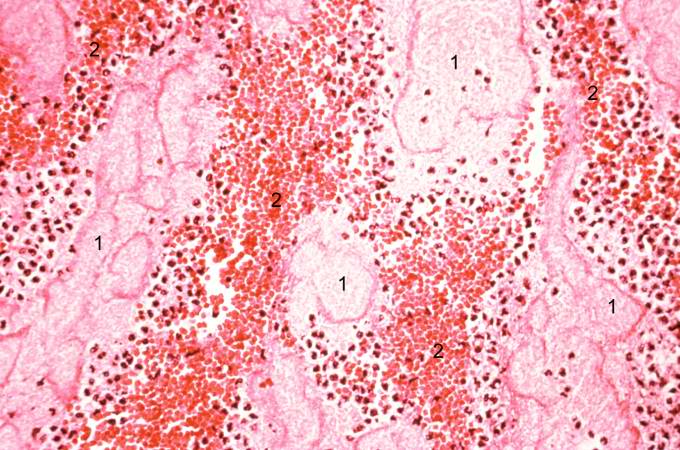
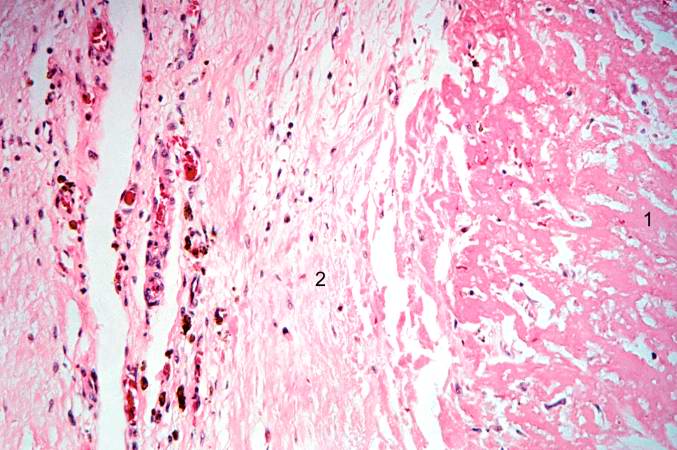
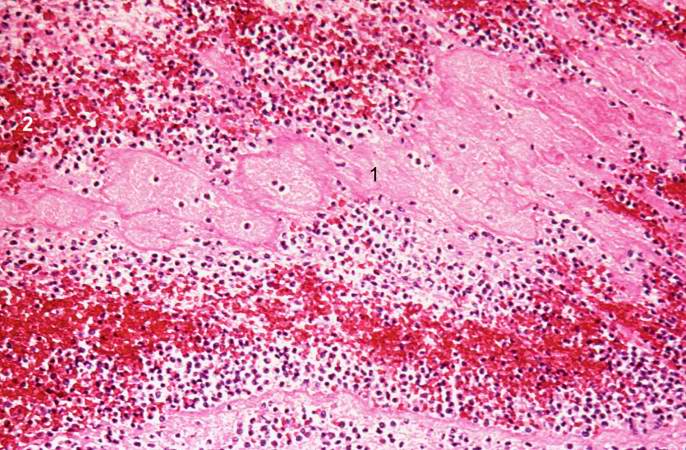
80 KB | This high-power photomicrograph of thrombus demonstrates more clearly the components of the layers--the pale regions which contain primarily platelets (degranulated platelets) with some fibrin (1), and the red areas which contain RBCs, some leukocytes,... | 1 |
| 16:29, 19 August 2013 | IPLab4MuralThrombus6.jpg (file) |  |
82 KB | This is a higher-power photomicrograph of the thrombus. Note the pale regions which contain primarily platelets (degranulated platelets) with some fibrin (1), and the red areas which contain RBCs, some leukocytes, and fibrin(2). | 1 |
| 16:29, 19 August 2013 | IPLab4MuralThrombus5.jpg (file) |  |
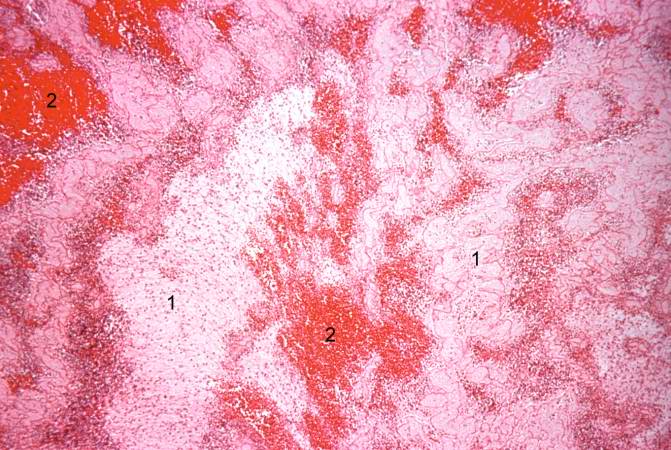
93 KB | This photomicrograph illustrates the layered effect of the thrombus. | 1 |
| 16:28, 19 August 2013 | IPLab4MuralThrombus4.jpg (file) |  |
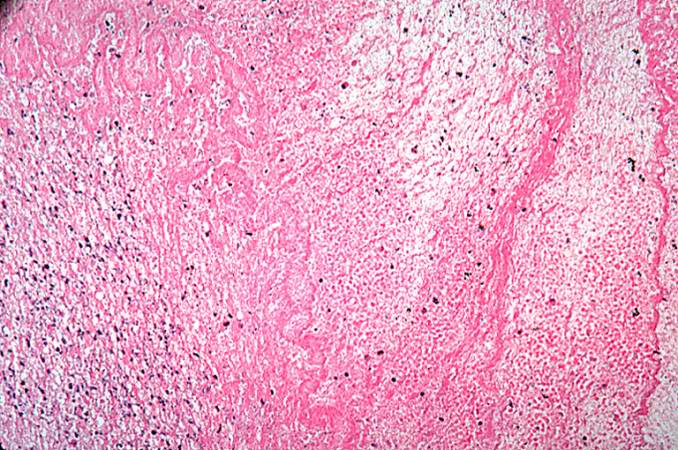
65 KB | This is a high-power photomicrograph of the border zone between the thrombus (1) and the endocardium (2). In this region there is less inflammation at the border zone. | 1 |
| 16:28, 19 August 2013 | IPLab4MuralThrombus3.jpg (file) |  |
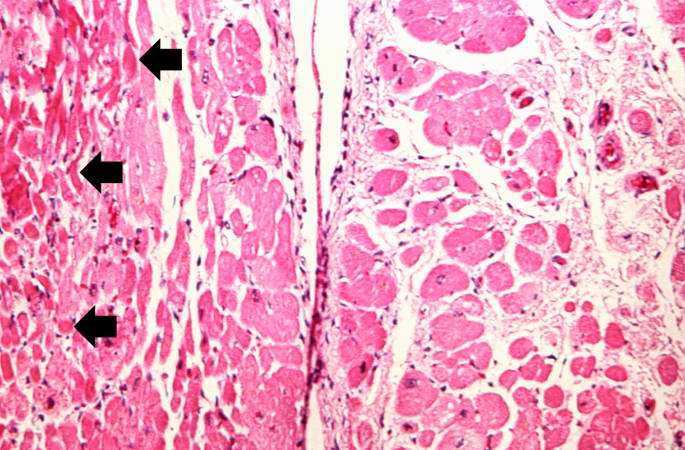
53 KB | This higher-power photomicrograph shows the border between the thrombus on the right (1) and the endocardium on the left (2). There is a line of inflammatory cells at this interface (arrow). | 1 |
| 16:27, 19 August 2013 | IPLab4MuralThrombus2.jpg (file) |  |
39 KB | This is a low-power photomicrograph of the thrombus (1) attached to the myocardium (2). | 1 |
| 16:27, 19 August 2013 | IPLab4MuralThrombus1.jpg (file) |  |
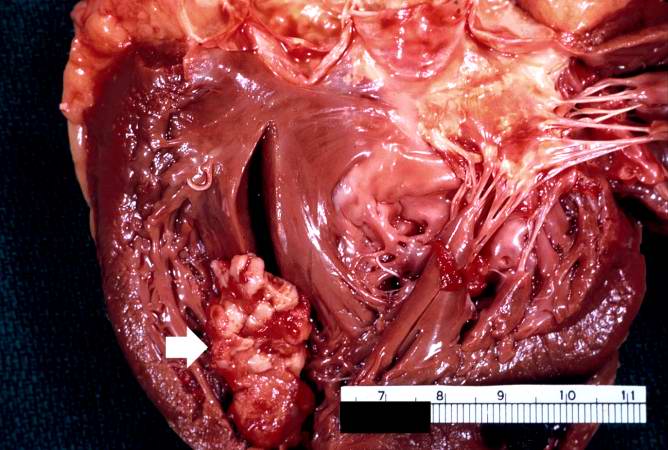
60 KB | This is a gross photograph of the heart from this case demonstrating the well-formed thrombus (arrow) tightly attached to the myocardium near the apex of the left ventricle. | 1 |
| 16:22, 19 August 2013 | IPLab4ChronicPassiveCongestion9.jpg (file) |  |
59 KB | This is a gross photograph of the cut surface of a liver with chronic passive congestion (left) compared to the cut surface of a nutmeg (right). | 1 |
| 16:22, 19 August 2013 | IPLab4ChronicPassiveCongestion8.jpg (file) |  |
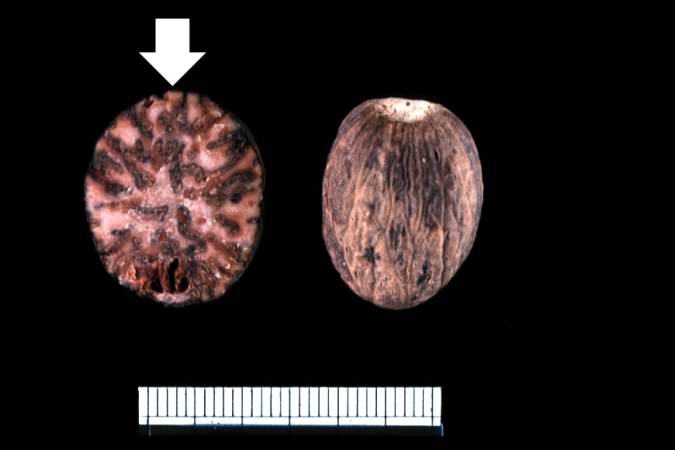
21 KB | This is a gross photograph of a nutmeg. You can see from the appearance of the cut surface of the nutmeg (arrow) why chronic passive congestion of the liver is sometimes referred to as "nutmeg liver." | 1 |
| 16:21, 19 August 2013 | IPLab4ChronicPassiveCongestion7.jpg (file) |  |
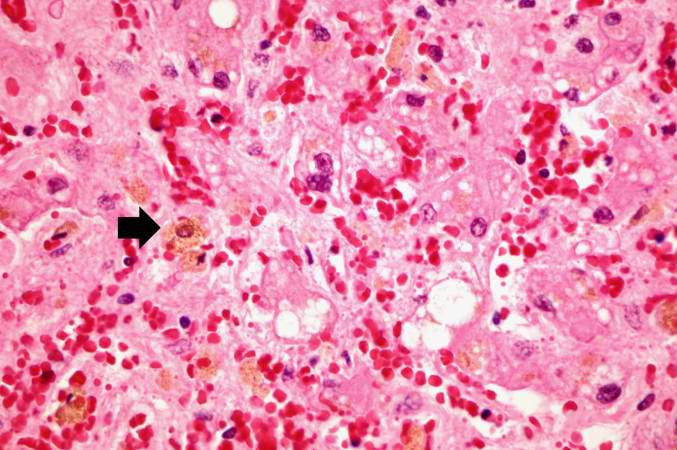
61 KB | This is a high-power photomicrograph of liver with several macrophages that are distended with a brown pigment (arrow). These resident macrophages (Kupffer cells) are part of the reticuloendothelial system and normally line the sinusoidal spaces in the... | 1 |
| 16:21, 19 August 2013 | IPLab4ChronicPassiveCongestion6.jpg (file) |  |
76 KB | This is a high-power photomicrograph of the central vein illustrating congestion and some loss of liver parenchymal cells. A mild increase in connective tissue around the central vein is evident in this section. | 1 |
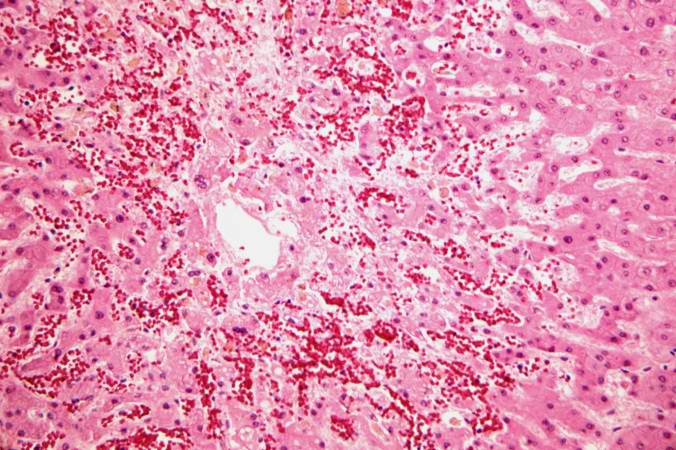
| 16:20, 19 August 2013 | IPLab4ChronicPassiveCongestion5.jpg (file) |  |
83 KB | This higher-power photomicrograph of the liver lobules shows congestion and red blood cell accumulation in the sinusoidal spaces around the central vein. Note that around the portal triads (arrows) the liver cells are quite normal and there is no evide... | 1 |
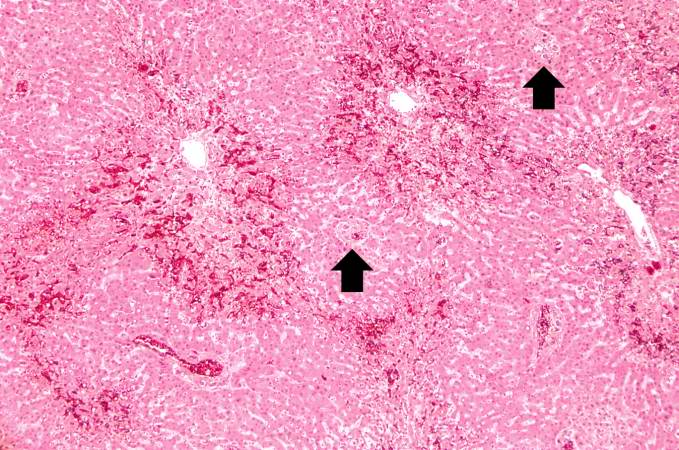
| 16:20, 19 August 2013 | IPLab4ChronicPassiveCongestion4.jpg (file) |  |
83 KB | This is a higher-power photomicrograph of liver demonstrating an accentuated lobular pattern with a dark red stain surrounding the central veins in the liver lobules (arrows). | 1 |
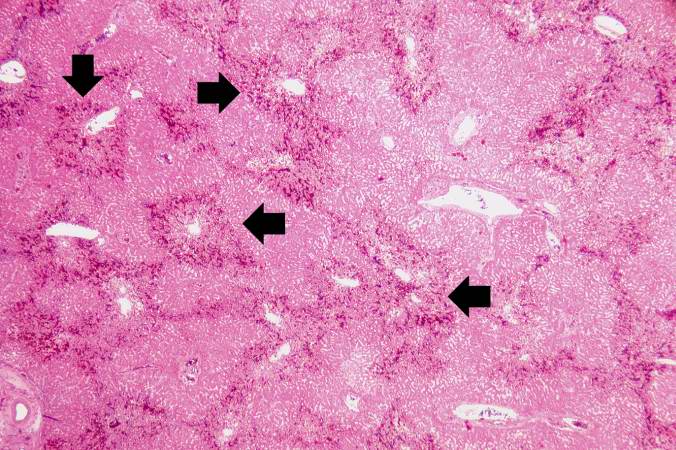
| 16:20, 19 August 2013 | IPLab4ChronicPassiveCongestion3.jpg (file) |  |
21 KB | This low-power photomicrograph of liver demonstrates a slightly visible pattern of centrilobular congestion at this magnification. | 1 |
| 16:19, 19 August 2013 | IPLab4ChronicPassiveCongestion2.jpg (file) |  |
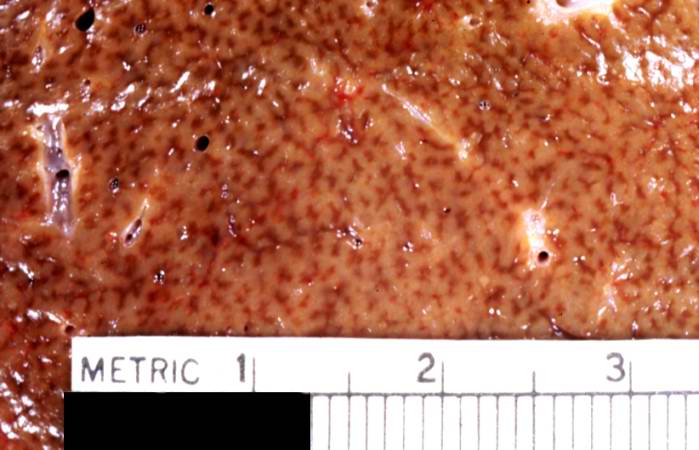
44 KB | This is a closer view of a cut section of liver demonstrating the pattern of chronic passive congestion. The central vein regions are red and the surrounding hepatic tissue is pale tan-brown. | 1 |
| 16:19, 19 August 2013 | IPLab4ChronicPassiveCongestion1.jpg (file) |  |
43 KB | This is a gross photograph of a liver demonstrating chronic passive congestion. Note the accentuation of the centrilobular pattern evidenced by the dark-brown-staining areas in this tissue. | 1 |
| 16:12, 19 August 2013 | IPLab4PulmonaryCongestion7.jpg (file) |  |
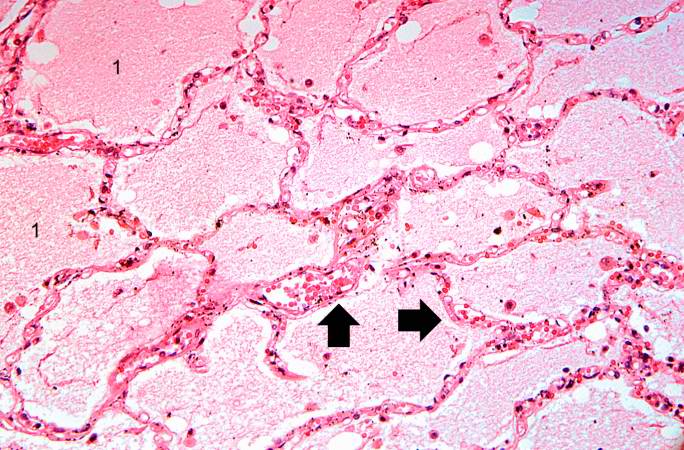
82 KB | This high-power photomicrograph illustrates the edema fluid within the alveoli (1) and the congestion (RBCs) in the alveolar capillaries (arrows). | 1 |
| 16:12, 19 August 2013 | IPLab4PulmonaryCongestion6.jpg (file) |  |
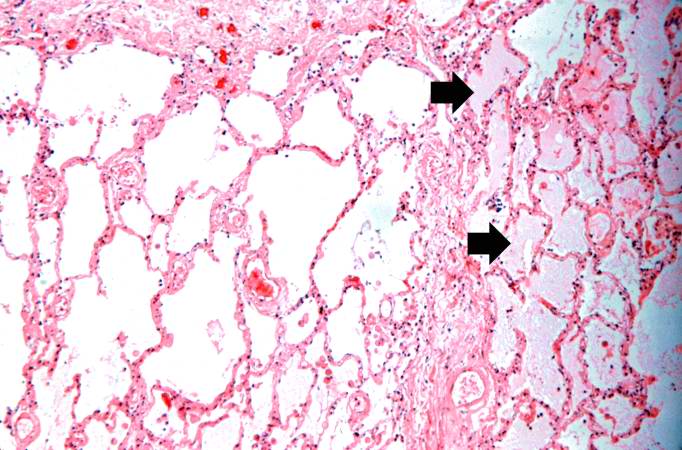
65 KB | This is a higher-power photomicrograph showing edema-filled alveoli in the right portion of this section (arrows). | 1 |
| 16:08, 19 August 2013 | IPLab4PulmonaryCongestion5.jpg (file) |  |
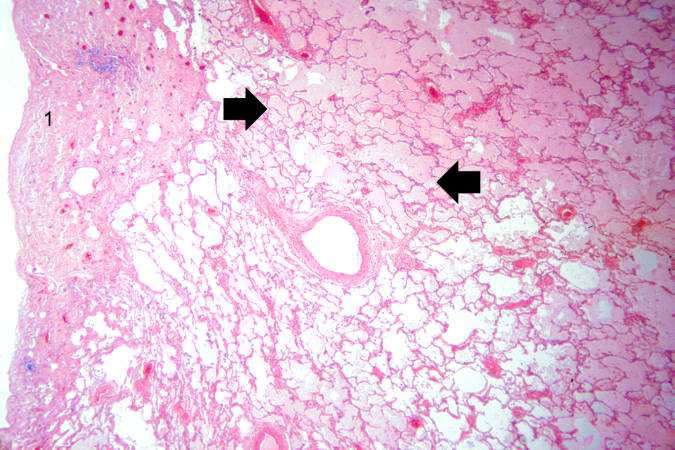
63 KB | This is a higher-power photomicrograph of lung. The edema fluid within the alveoli is visible at this higher magnification (arrows). The thickened pleura (1) is on the left. | 1 |
| 16:07, 19 August 2013 | IPLab4PulmonaryCongestion4.jpg (file) |  |
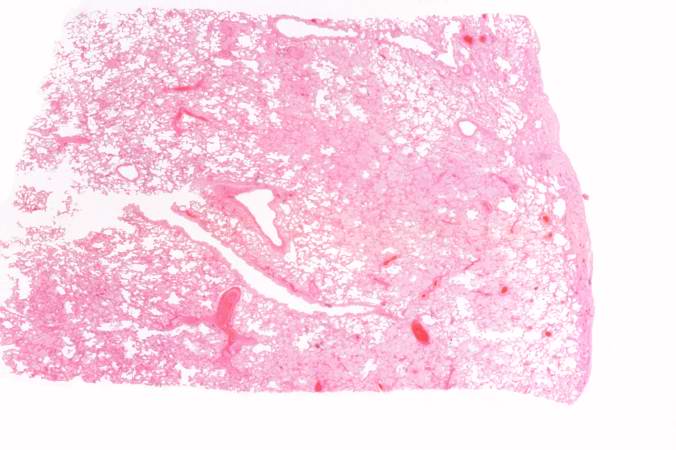
42 KB | This is a low-power photomicrograph of lung from this case. The lung section has a pale-red color indicating proteinaceous material within the lung. | 1 |
| 16:07, 19 August 2013 | IPLab4PulmonaryCongestion3.jpg (file) |  |
48 KB | This gross photograph demonstrates the frothy exudate that is being extruded from the lung tissue. | 1 |
| 16:07, 19 August 2013 | IPLab4PulmonaryCongestion2.jpg (file) |  |
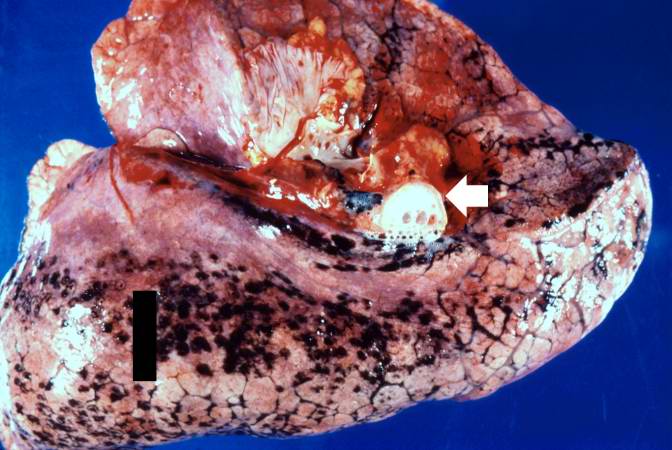
54 KB | This is a gross photograph of lung demonstrating acute pulmonary congestion and edema. A frothy exudate fills the bronchus (arrow). | 1 |
| 16:06, 19 August 2013 | IPLab4PulmonaryCongestion1.jpg (file) |  |
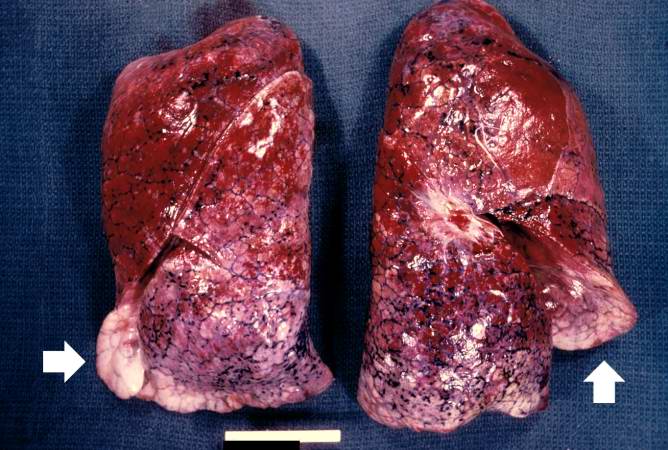
64 KB | This is a gross photograph of lungs that are distended and red. The reddish coloration of the tissue is due to congestion. Some normal pink lung tissue is seen at the edges of the lungs (arrows). | 1 |
| 04:39, 19 August 2013 | IPLab3HealedMyocardialInfarction8.jpg (file) |  |
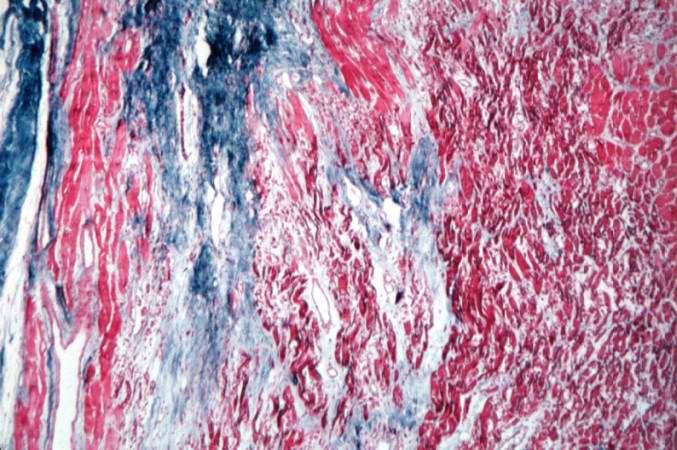
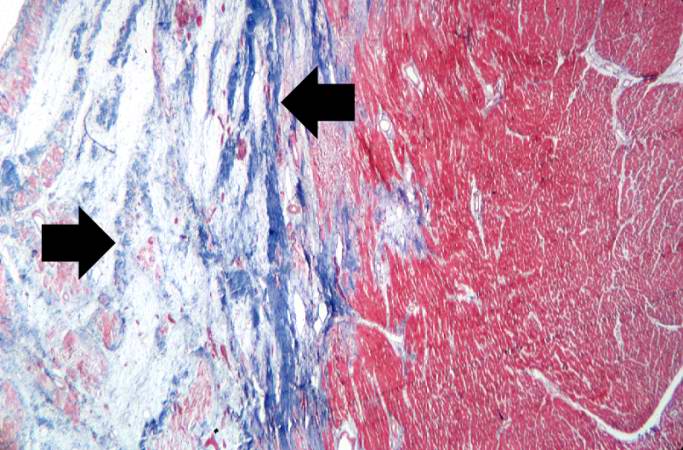
73 KB | This is a higher-power photomicrograph of a trichrome-stained section of heart containing an old healed MI. The scar tissue (mature fibrous connective tissue) is stained blue. | 1 |
| 04:38, 19 August 2013 | IPLab3HealedMyocardialInfarction7.jpg (file) |  |
71 KB | This is a photomicrograph of a trichrome-stained section of heart containing an old healed myocardial infarction. The scar is composed of mature fibrous connective tissue (arrows). | 1 |
| 04:38, 19 August 2013 | IPLab3HealedMyocardialInfarction6.jpg (file) |  |
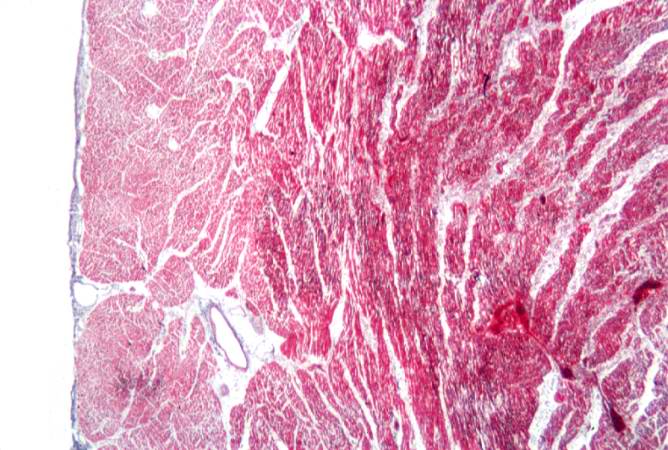
70 KB | This is a photomicrograph of a trichrome-stained section from a heart with an acute myocardial infarction. Note that there is little fibrous connective tissue. It is too early for scar formation to have taken place in this acute lesion. | 1 |
| 04:37, 19 August 2013 | IPLab3HealedMyocardialInfarction5.jpg (file) |  |
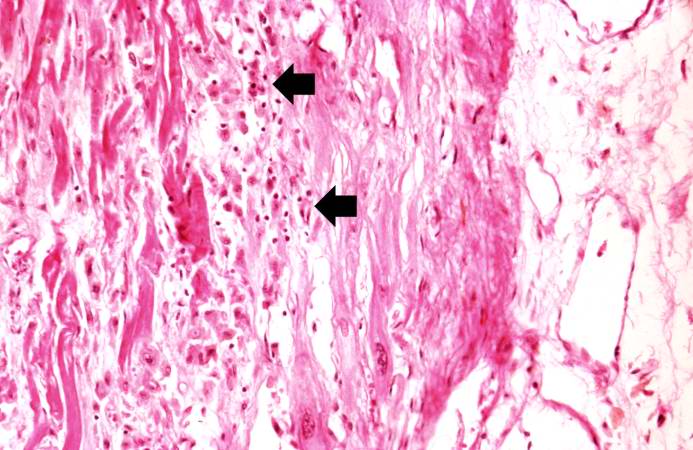
36 KB | This is a high-power photomicrograph of a different region of this healed MI. Note the chronic inflammatory reaction (arrows) in this region suggesting that there had been ischemic injury to this area within the last several weeks to months. | 1 |
| 04:37, 19 August 2013 | IPLab3HealedMyocardialInfarction4.jpg (file) |  |
61 KB | This is another high-power photomicrograph of a healed myocardial infarction. Note the remaining normal myocytes (1), the fibrous connective tissue (2), and occasional hypereosinophilic myocytes indicating recent acute ischemic injury (arrow). | 1 |
| 04:37, 19 August 2013 | IPLab3HealedMyocardialInfarction3.jpg (file) |  |
71 KB | This is a higher-power photomicrograph of a healed myocardial infarction with a fibrous scar. Remaining normal tissue is at the top (1) and the fibrous connective tissue scar is at the bottom (2). Note the presence of occasional hypereosinophilic myocy... | 1 |
| 04:36, 19 August 2013 | IPLab3HealedMyocardialInfarction2.jpg (file) |  |
75 KB | This is a low-power photomicrograph of a healed myocardial infarction with a fibrous scar. Remaining normal tissue is on the left (1) and the fibrous connective tissue scar is on the right (2). | 1 |
| 04:36, 19 August 2013 | IPLab3HealedMyocardialInfarction1.jpg (file) |  |
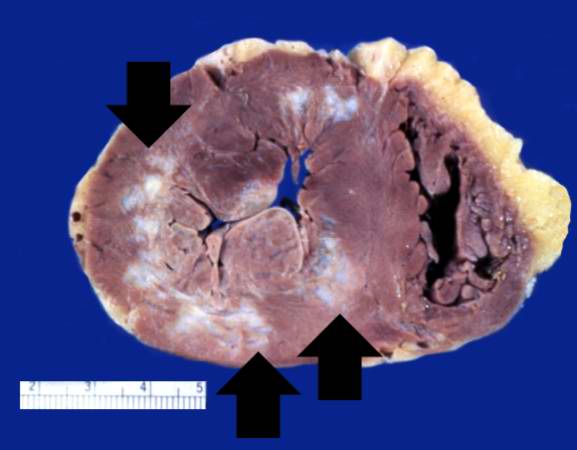
25 KB | This is a gross photograph of a heart with areas of old healed myocardial infarction (scars) outlined by arrows. | 1 |
| 04:30, 19 August 2013 | IPLab3AcuteMyocardialInfarction7.jpg (file) |  |
88 KB | This is a photomicrograph of the lines of Zahn. Pale areas (1) represent platelets with some fibrin and the darker lines (2) represent RBCs and leukocytes enmeshed in fibrin strands. | 1 |
| 04:30, 19 August 2013 | IPLab3AcuteMyocardialInfarction6.jpg (file) |  |
79 KB | This is a low-power photomicrograph of a mural thrombus (1) adherent to the endocardial surface (arrows). | 1 |
| 04:30, 19 August 2013 | IPLab3AcuteMyocardialInfarction5.jpg (file) |  |
68 KB | This is a high-power photomicrograph of another area of this section. There are several hypereosinophilic cells within this section (arrows). | 1 |
| 04:30, 19 August 2013 | IPLab3AcuteMyocardialInfarction4.jpg (file) |  |
79 KB | This is a higher-power photomicrograph of the edge of the infarct. The accumulation of inflammatory cells is on the left (1) and the infarcted tissue is on the right (2). Note that intact cells can be seen in the infarct but there are no nuclei. | 1 |
| 04:29, 19 August 2013 | IPLab3AcuteMyocardialInfarction3.jpg (file) |  |
83 KB | This is a photomicrograph of the edge of the infarct with normal tissue on the left (1). The accumulation of inflammatory cells (2) is at the edge of the infarcted tissue (3). | 1 |
| 04:29, 19 August 2013 | IPLab3AcuteMyocardialInfarction2.jpg (file) |  |
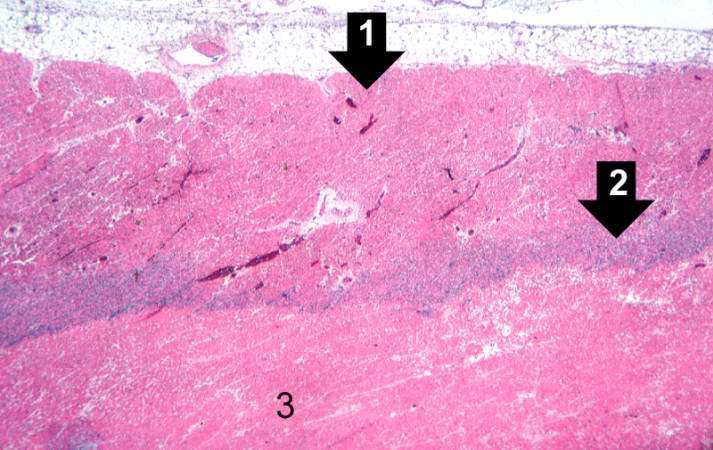
60 KB | This is a higher-power photomicrograph which shows more clearly the viable tissue along the epicardium (1), the blue line of inflammatory cells (2), and the infarcted myocardium (3). | 1 |
| 04:29, 19 August 2013 | IPLab3AcuteMyocardialInfarction1.jpg (file) |  |
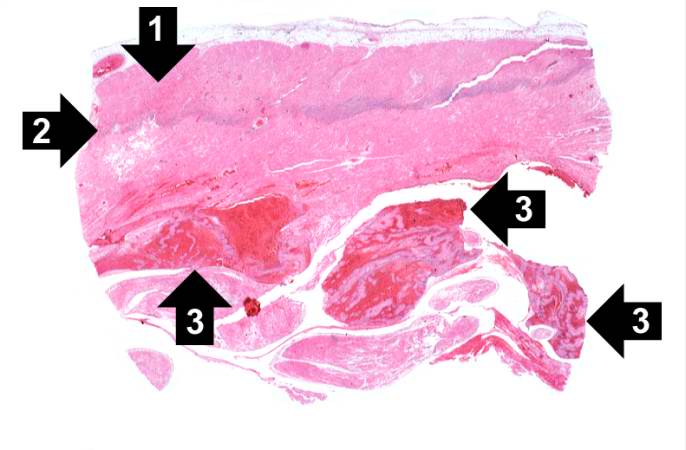
36 KB | This is a low-power photomicrograph of infarcted heart. There is a layer of surviving myocardial tissue (1) along the epicardium and then a blue line (2) which represents the accumulation of inflammatory cells at the border of the infarct. There is thr... | 1 |
| 04:24, 19 August 2013 | IPLab3BrainInfarction11.jpg (file) |  |
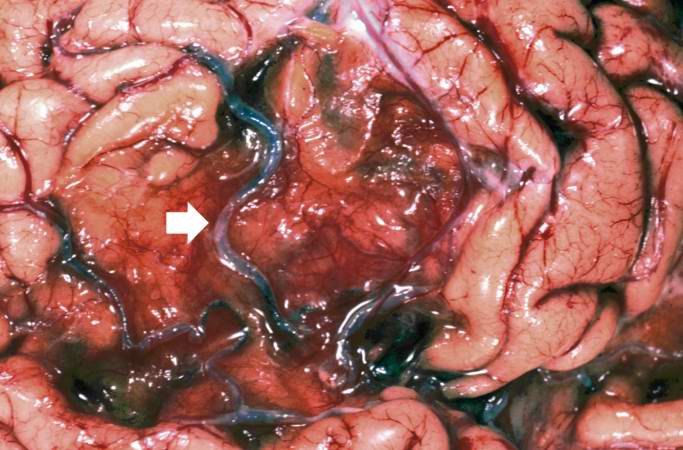
56 KB | This is a closer view of the brain demonstrating an old healed infarct with the meninges containing blood vessels (arrow) overlying the infarcted region. | 1 |
| 04:24, 19 August 2013 | IPLab3BrainInfarction10.jpg (file) |  |
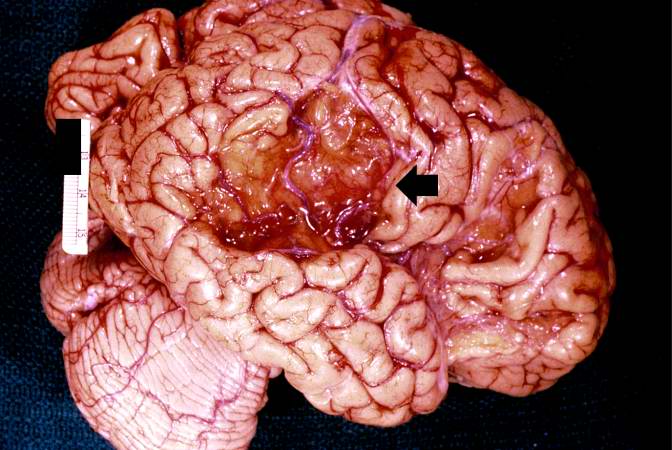
56 KB | This is a gross photograph of a brain from another patient with an old healed infarct. Note the meninges overlying the infarcted region (arrow). | 1 |
| 04:23, 19 August 2013 | IPLab3BrainInfarction9.jpg (file) |  |
43 KB | This is a photomicrograph of the edge of the infarct. Note the gitter cells, gemistocytic astrocytes, and some hemosiderin-laden macrophages (arrows). | 1 |
| 04:23, 19 August 2013 | IPLab3BrainInfarction8.jpg (file) |  |
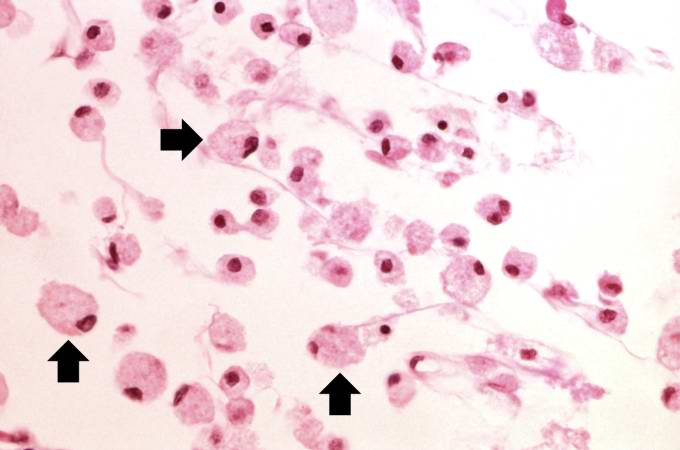
28 KB | This is a high-power photomicrograph of gitter cells (arrows). | 1 |
| 04:23, 19 August 2013 | IPLab3BrainInfarction7.jpg (file) |  |
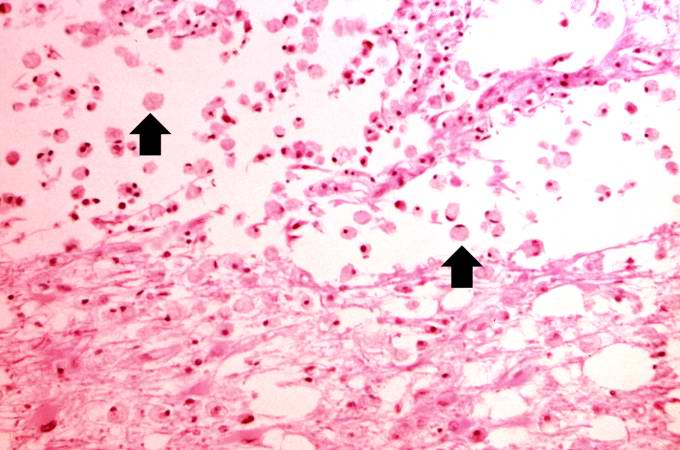
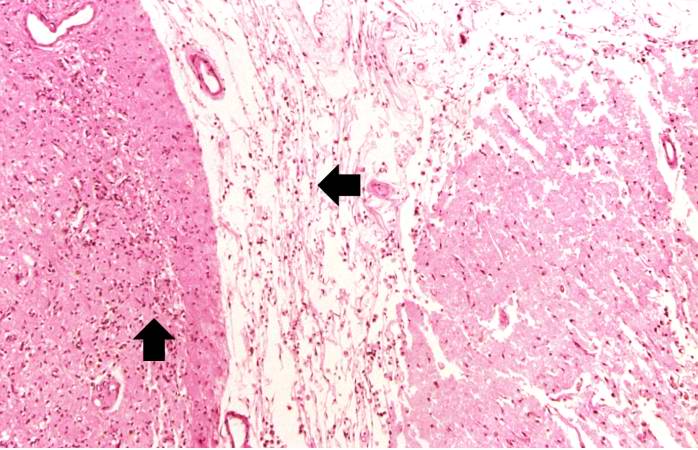
50 KB | This is a photomicrograph of the edge of the infarct. The macrophages that are full of brain tissue (“gitter cells”) are at the top of the image (arrows) and the brain parenchyma containing gemistocytic astrocytes is at the bottom. | 1 |
| 04:22, 19 August 2013 | IPLab3BrainInfarction6.jpg (file) |  |
55 KB | This is a photomicrograph of brain tissue adjacent to the area of infarction. There are numerous activated gemistocytic astrocytes (arrows). | 1 |
| 04:22, 19 August 2013 | IPLab3BrainInfarction5.jpg (file) |  |
51 KB | This is a higher-power photomicrograph of the previous image showing that the inflammatory cells (arrows) are primarily macrophages and microglia which have phagocytosed the dead brain tissue. | 1 |
| 04:22, 19 August 2013 | IPLab3BrainInfarction4.jpg (file) |  |
68 KB | This is a photomicrograph of the edge of the infarct. Note the numerous inflammatory cells in the brain parenchyma and adjacent to the remaining brain tissue (arrows). | 1 |
| 04:22, 19 August 2013 | IPLab3BrainInfarction3.jpg (file) |  |
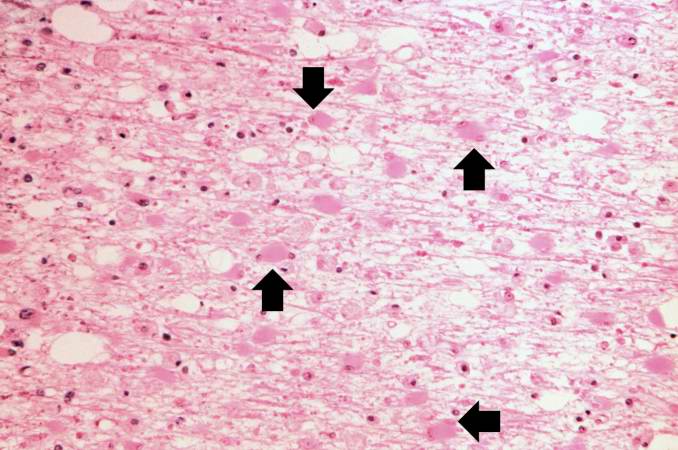
51 KB | This is a low-power photomicrograph of brain at the edge of the infarct. Note the loss of brain parenchyma (arrows). | 1 |
| 04:22, 19 August 2013 | IPLab3BrainInfarction2.jpg (file) |  |
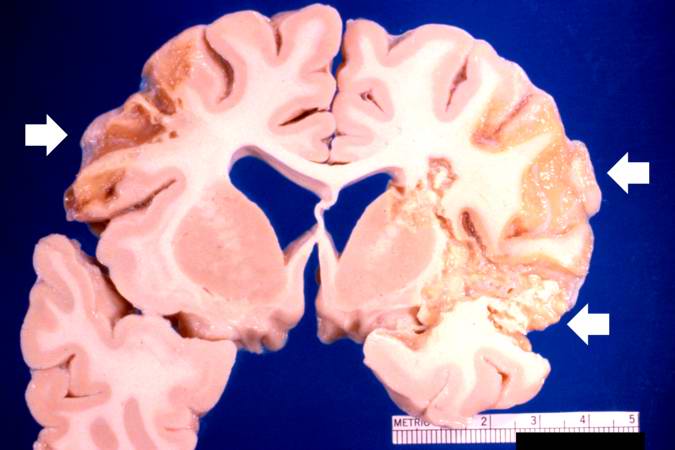
32 KB | This is a gross photograph of a cross-section of brain demonstrating the areas of infarction (arrows). | 1 |
| 04:21, 19 August 2013 | IPLab3BrainInfarction1.jpg (file) |  |
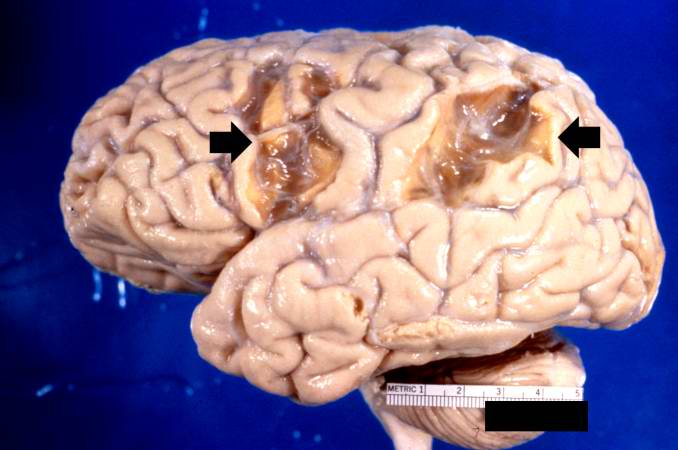
37 KB | This is a gross photograph of the brain which contains two areas of infarction (arrows). | 1 |